

Waiting times for radiotherapy: variation over time and between cancer networks in southeast England
- PMID: 15785752
- PMCID: PMC2361967
- DOI: 10.1038/sj.bjc.6602463
Waiting times for radiotherapy: variation over time and between cancer networks in southeast England
Abstract
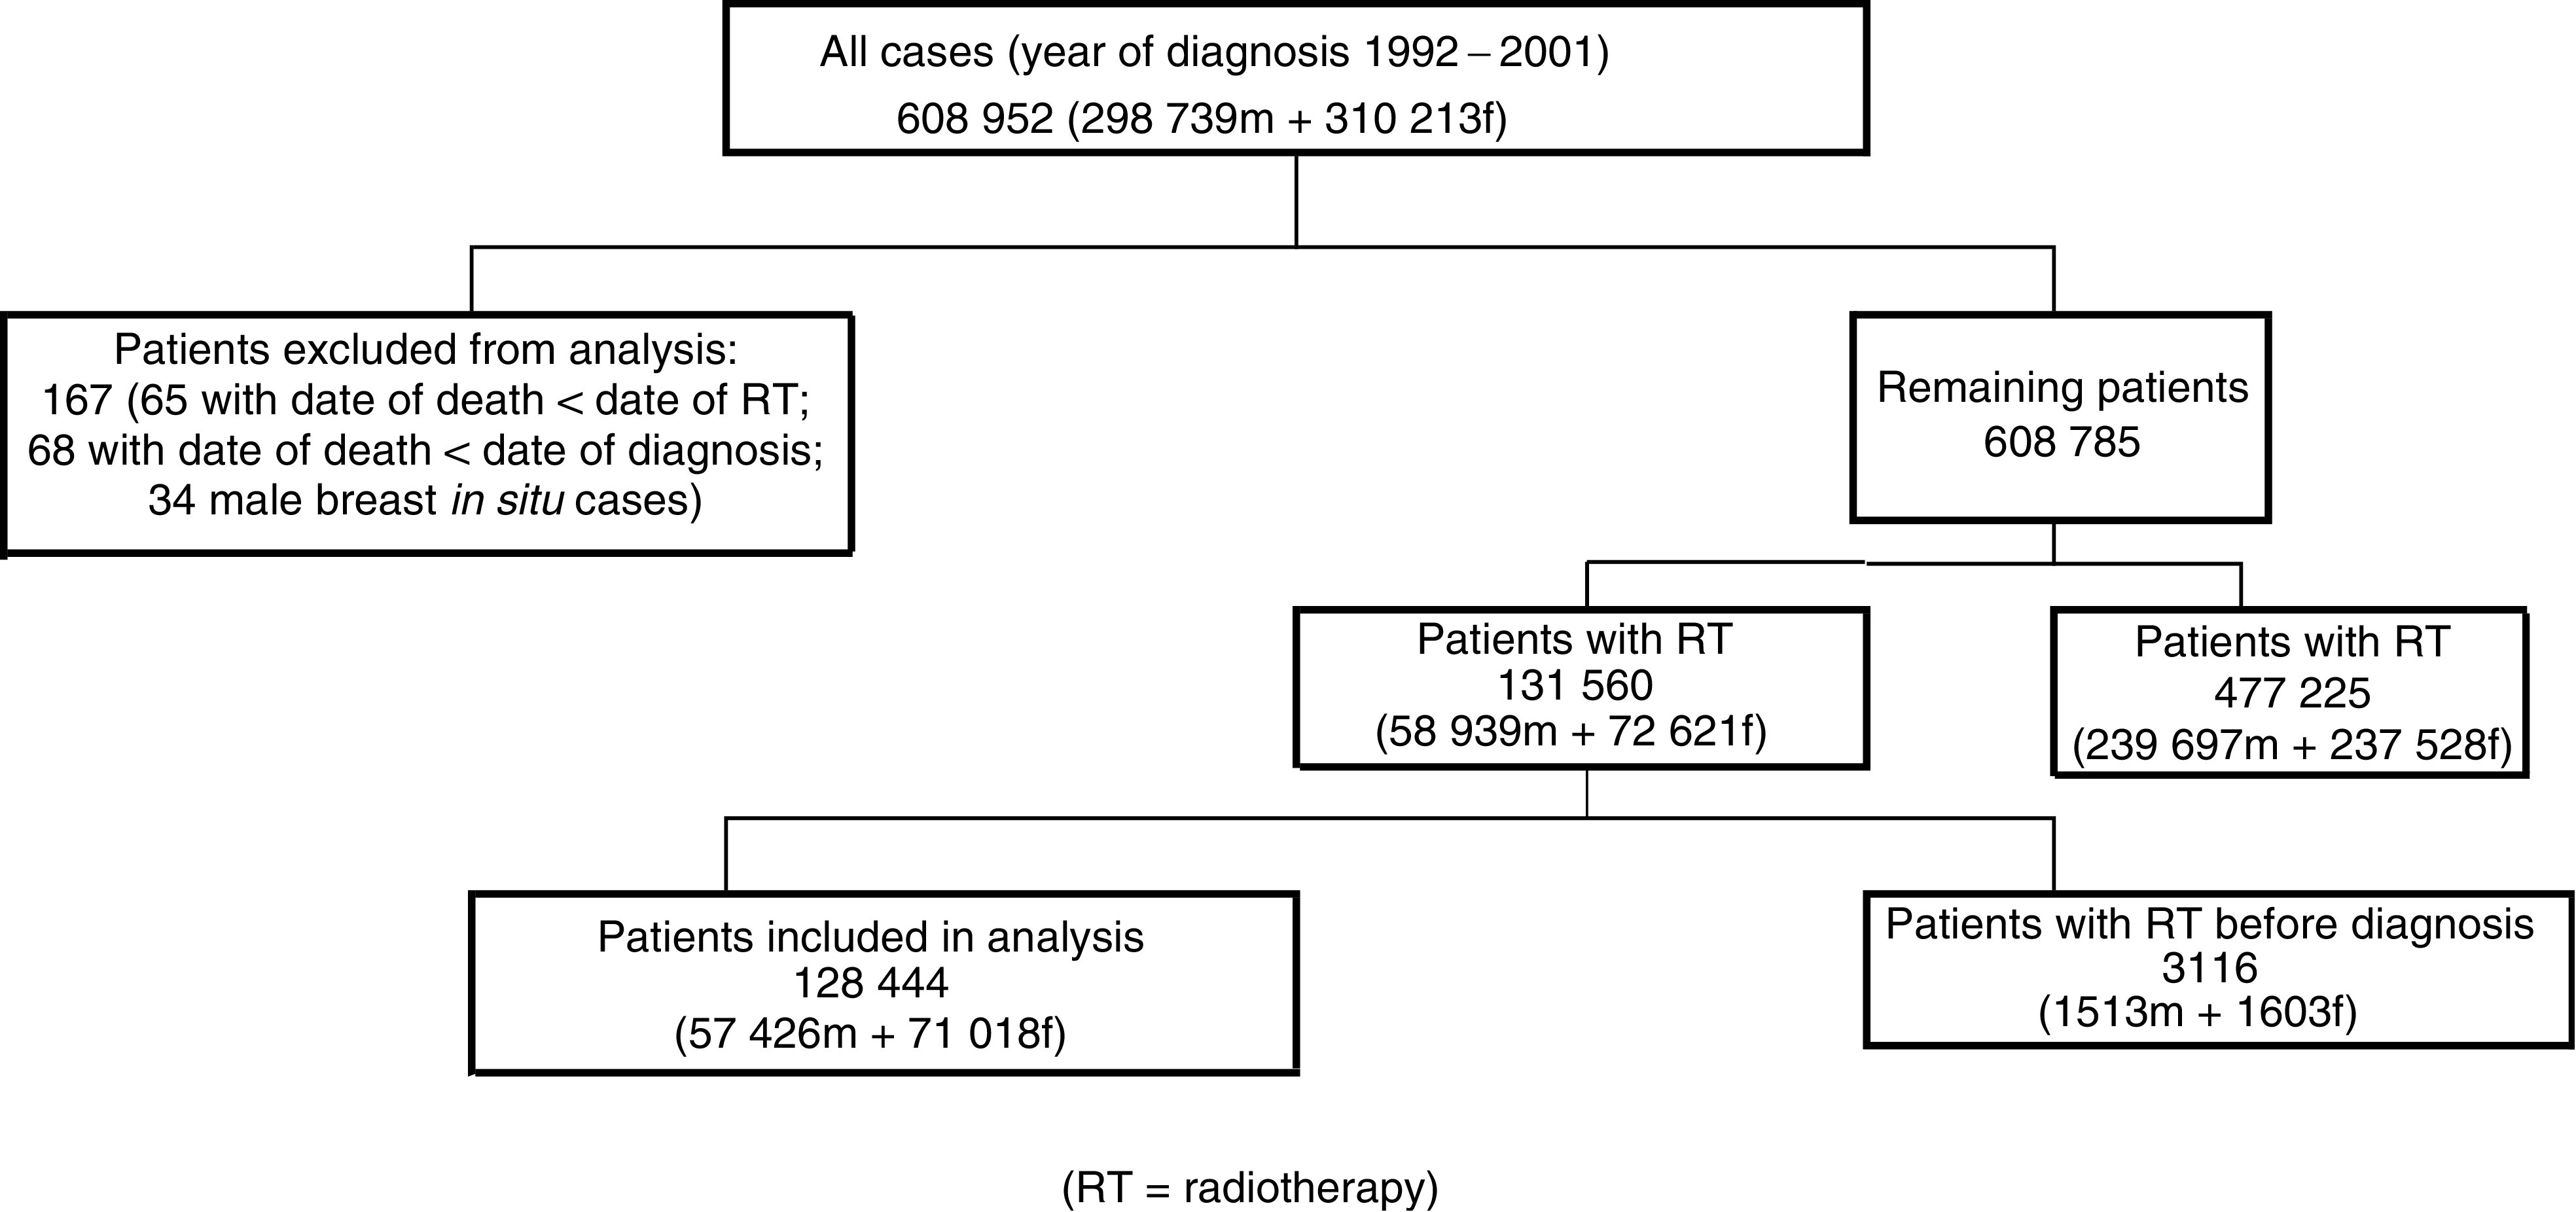
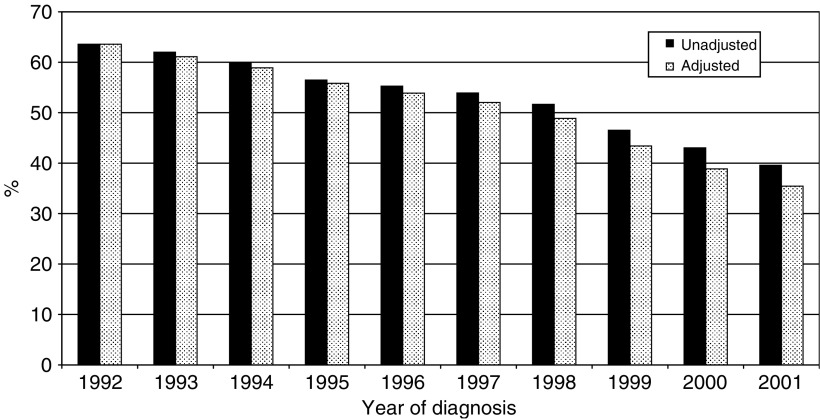
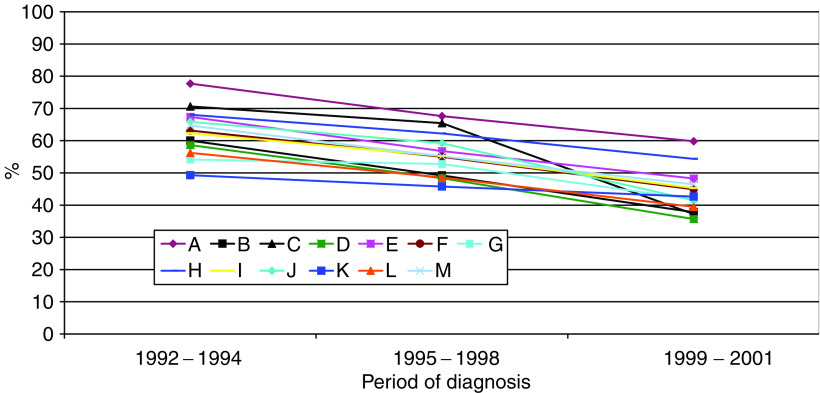
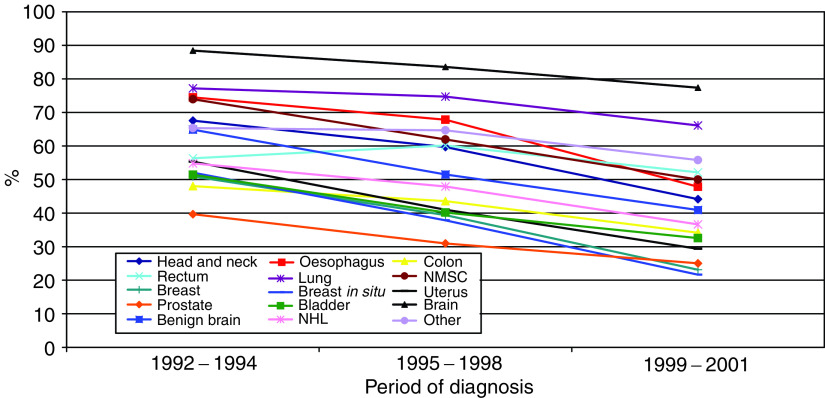
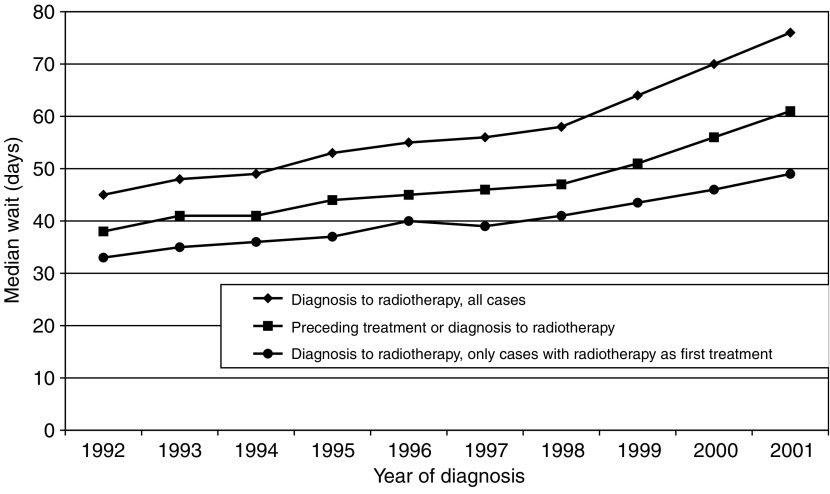
The aim of this study was to investigate variations in the length of time that patients with cancer wait from diagnosis to treatment with radiotherapy. A total of 57,426 men and 71,018 women diagnosed with cancer between 1992 and 2001 and receiving radiotherapy within 6 months of diagnosis were identified from the Thames Cancer Registry database. In total, 12 sites were identified for which a substantial number or proportion of patients received radiotherapy: head and neck, oesophagus, colon, rectum, lung, nonmelanoma skin cancer, breast, uterus, prostate, bladder, brain and non-Hodgkin's lymphoma. Median waiting times from diagnosis to radiotherapy were calculated, together with the proportion of patients who received radiotherapy within 60 days of diagnosis, and analysed by year of diagnosis, cancer site, deprivation quintile, age at diagnosis, sex and cancer network of either residence or treatment. Logistic regression was used to adjust the proportion receiving treatment within 60 days for the effects of the other factors. There were significant differences in the proportions receiving radiotherapy within 60 days between different networks and different cancer sites, which remained after adjustment. Median waiting times varied from 42 to 65 days across networks of residence, with the adjusted proportion treated within 60 days ranging from 44 to 71%. There was no difference between male and female patients after adjustment for the other factors, particularly site. There was a highly significant trend over time: the median wait increased from 45 days in 1992 to 76 days in 2001, while the adjusted proportion being treated within 60 days declined by almost a half, from 64 to 35%, over the same period.
Figures
Similar articles
-
Radiotherapy waiting times for women with breast cancer: a population-based cohort study.BMC Cancer. 2007 May 1;7:71. doi: 10.1186/1471-2407-7-71. BMC Cancer. 2007. PMID: 17472746 Free PMC article.
-
Factors associated with initial treatment and survival for clinically localized prostate cancer: results from the CDC-NPCR Patterns of Care Study (PoC1).BMC Cancer. 2010 Apr 19;10:152. doi: 10.1186/1471-2407-10-152. BMC Cancer. 2010. PMID: 20403178 Free PMC article.
-
Waiting for radiotherapy in Ontario.Int J Radiat Oncol Biol Phys. 1994 Aug 30;30(1):221-8. doi: 10.1016/0360-3016(94)90538-x. Int J Radiat Oncol Biol Phys. 1994. PMID: 8083117
-
Italian cancer figures--Report 2015: The burden of rare cancers in Italy.Epidemiol Prev. 2016 Jan-Feb;40(1 Suppl 2):1-120. doi: 10.19191/EP16.1S2.P001.035. Epidemiol Prev. 2016. PMID: 26951748
-
Radiotherapy waiting time in Northern Nigeria: experience from a resource-limited setting.Ecancermedicalscience. 2020 Sep 4;14:1097. doi: 10.3332/ecancer.2020.1097. eCollection 2020. Ecancermedicalscience. 2020. PMID: 33082847 Free PMC article. Review.
Cited by
-
Wait times for breast cancer care.Br J Cancer. 2007 Jan 15;96(1):162-8. doi: 10.1038/sj.bjc.6603523. Epub 2006 Dec 19. Br J Cancer. 2007. PMID: 17179986 Free PMC article.
-
The occurrence of invasive cancers following a diagnosis of breast carcinoma in situ.Br J Cancer. 2008 Aug 19;99(4):611-5. doi: 10.1038/sj.bjc.6604524. Epub 2008 Jul 29. Br J Cancer. 2008. PMID: 18665169 Free PMC article.
-
An evaluation of an advanced practice role in palliative radiation therapy.J Med Radiat Sci. 2019 Jun;66(2):96-102. doi: 10.1002/jmrs.318. Epub 2019 Feb 26. J Med Radiat Sci. 2019. PMID: 30809974 Free PMC article.
-
Waiting time for radiotherapy in women with cervical cancer.Rev Saude Publica. 2015;49:92. doi: 10.1590/S0034-8910.2015049005953. Epub 2015 Dec 31. Rev Saude Publica. 2015. PMID: 26786473 Free PMC article.
-
Assessment of performance indicators of a radiotherapy department using an electronic medical record system.Rep Pract Oncol Radiother. 2017 Sep-Oct;22(5):360-367. doi: 10.1016/j.rpor.2017.06.002. Epub 2017 Jul 21. Rep Pract Oncol Radiother. 2017. PMID: 28761392 Free PMC article.
References
-
- Afzelius P, Zedeler K, Sommer H, Mouridsen HT, Blichert-Toft M (1994) Patient's and doctor's delay in primary breast cancer. Prognostic implications. Acta Oncol 33: 345–351 - PubMed
-
- Arndt V, Stürmer T, Stegmaier C, Ziegler H, Becker A, Brenner H (2003) Provider delay among patients with breast cancer in Germany: a population-based study. J Clin Oncol 21: 1440–1446 - PubMed
-
- Ash D, Barrett A, Hinks A, Squire C (2004) Re-audit of radiotherapy waiting times 2003. Clin Oncol 16: 387–394 - PubMed
-
- Bozcuk H, Martin C (2001) Does treatment delay affect survival in non-small cell lung cancer? A retrospective analysis from a single UK centre. Lung Cancer 34: 243–252 - PubMed
-
- Brouha XDR, Op de Coul B, Terhaard CHJ, Hordijk GJ (2000) Does waiting time for radiotherapy affect local control of T1N0M0 glottic laryngeal carcinoma? Clin Otolaryngol 25: 215–218 - PubMed
MeSH terms
LinkOut - more resources
Full Text Sources
Medical
