

Recent trends in cancer mortality in the UK
- PMID: 15785754
- PMCID: PMC2361977
- DOI: 10.1038/sj.bjc.6602450
Recent trends in cancer mortality in the UK
Abstract
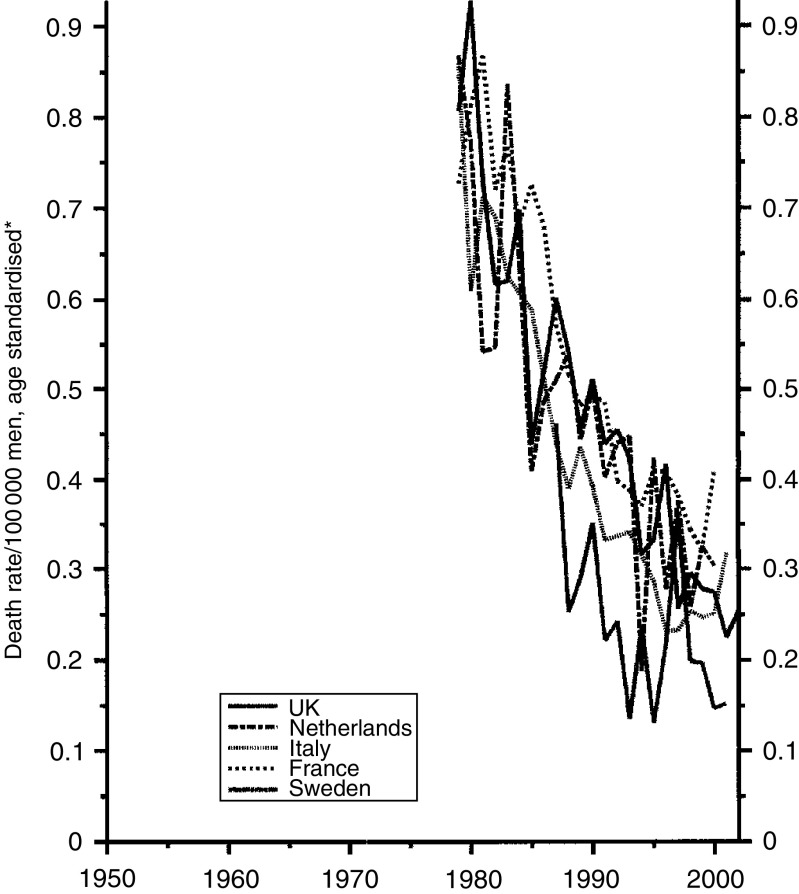
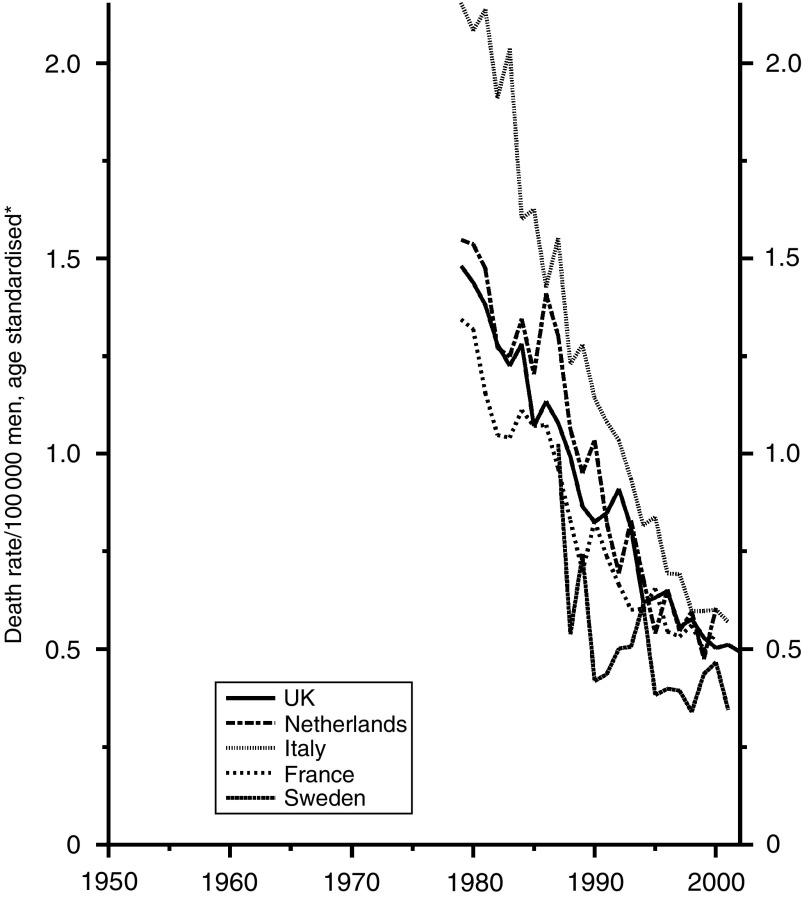
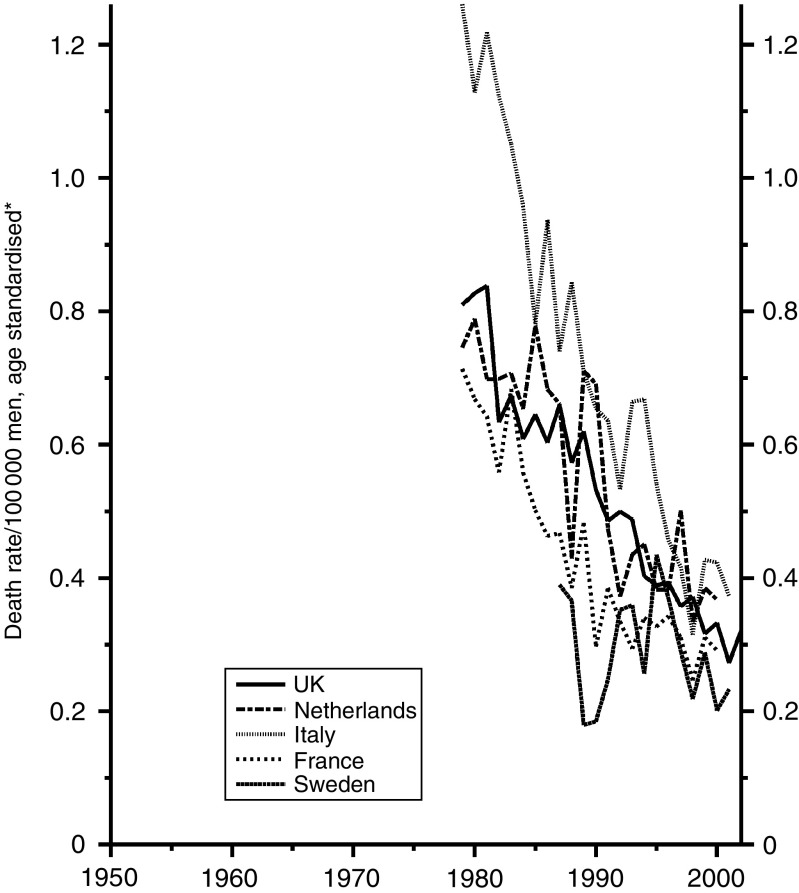
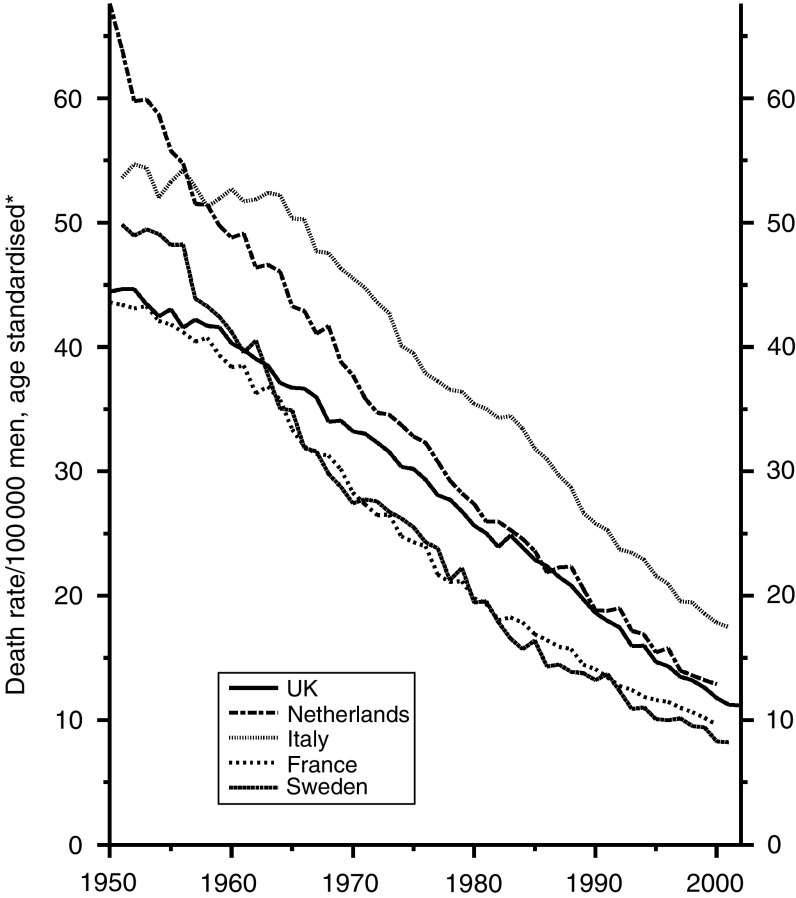
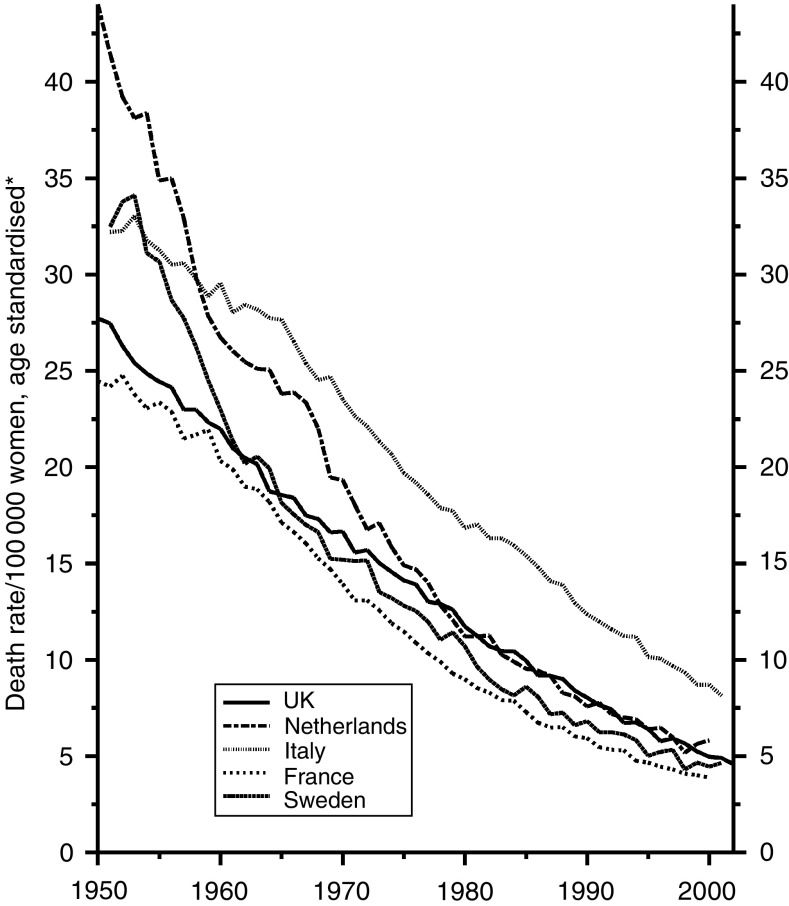
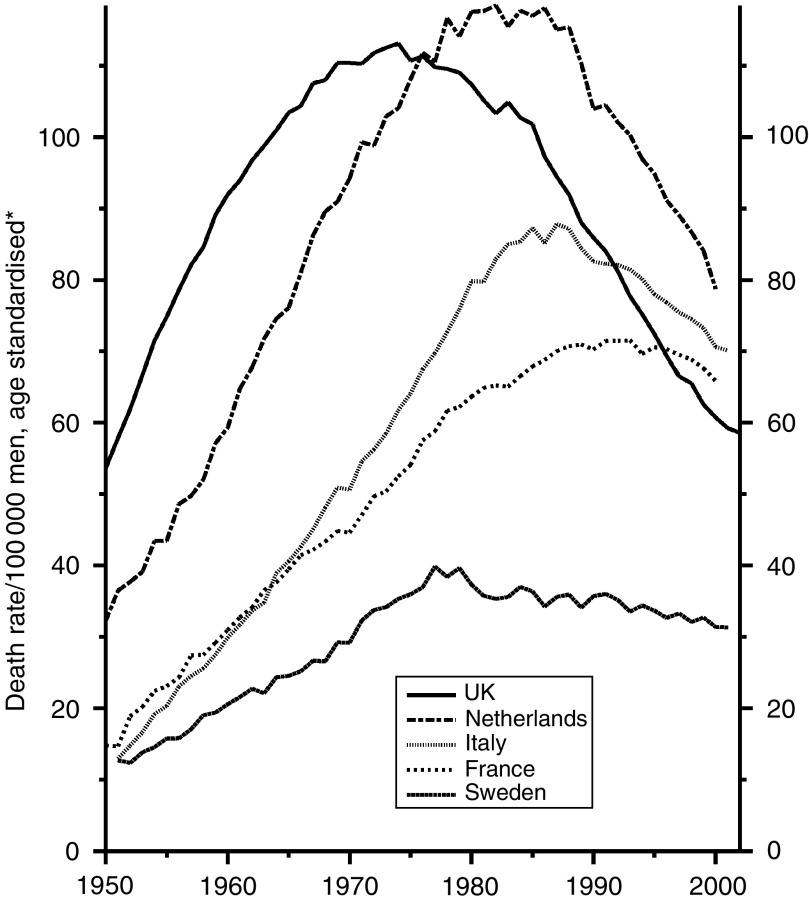
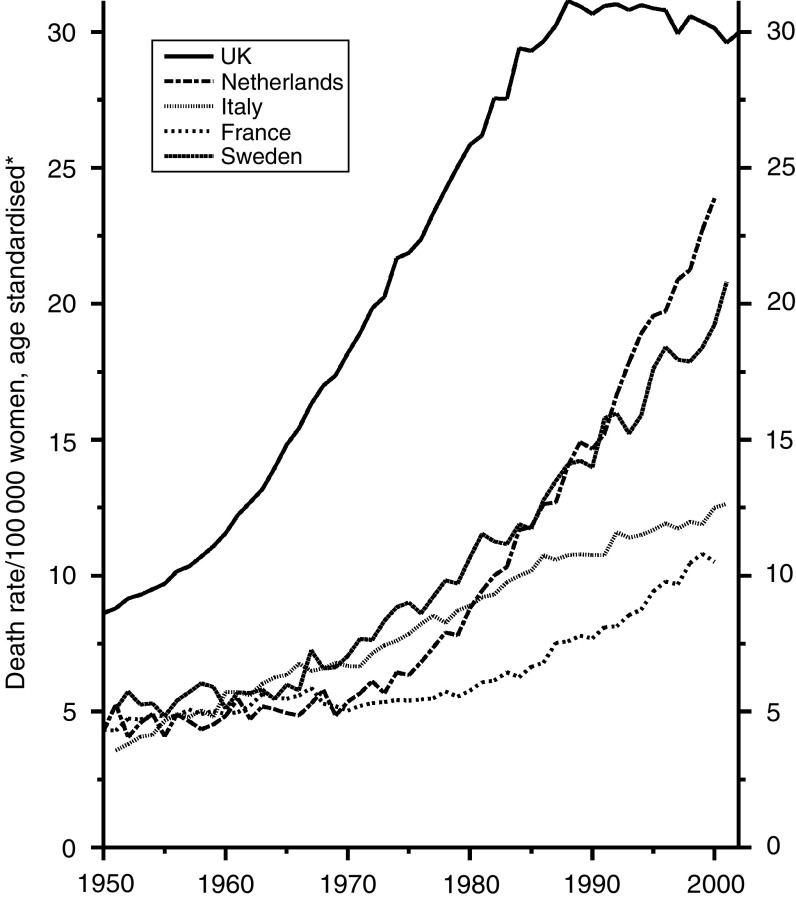
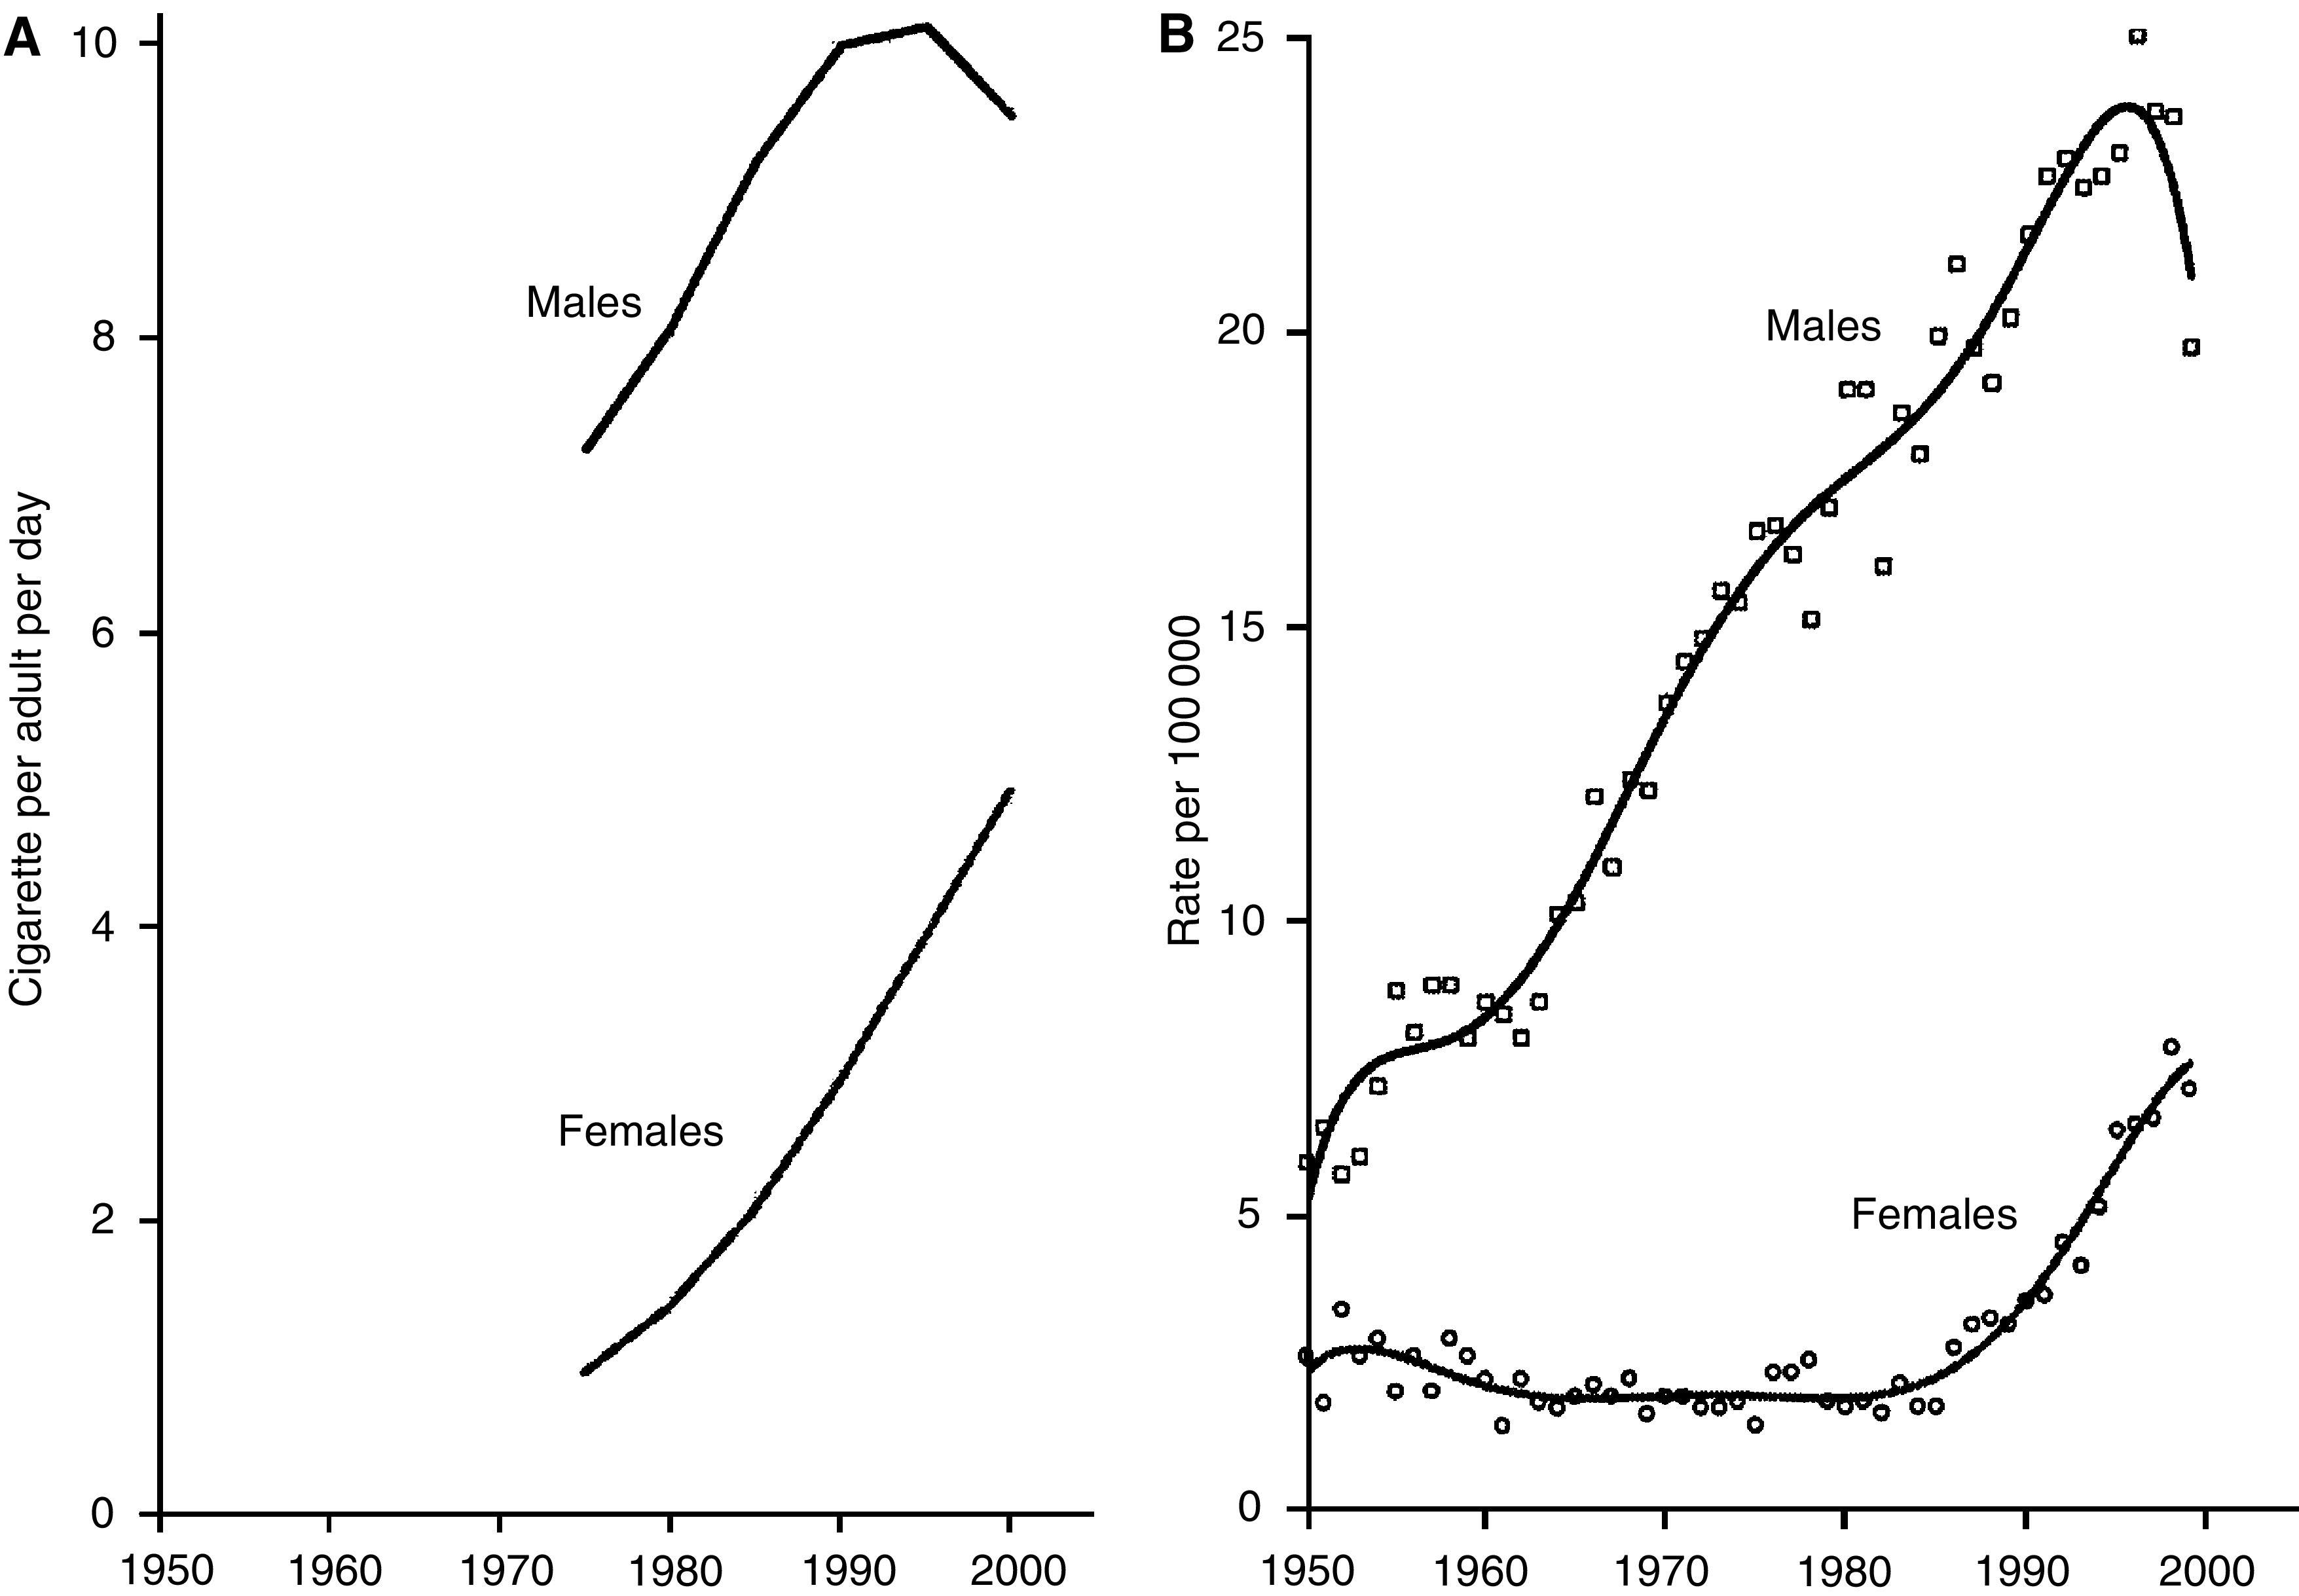
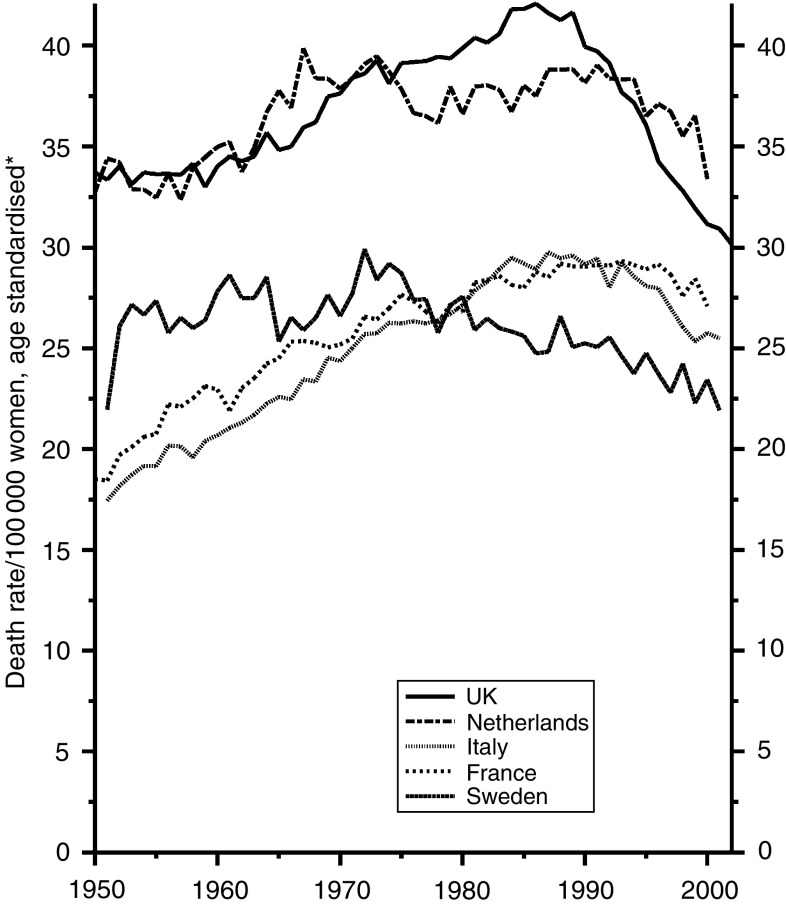
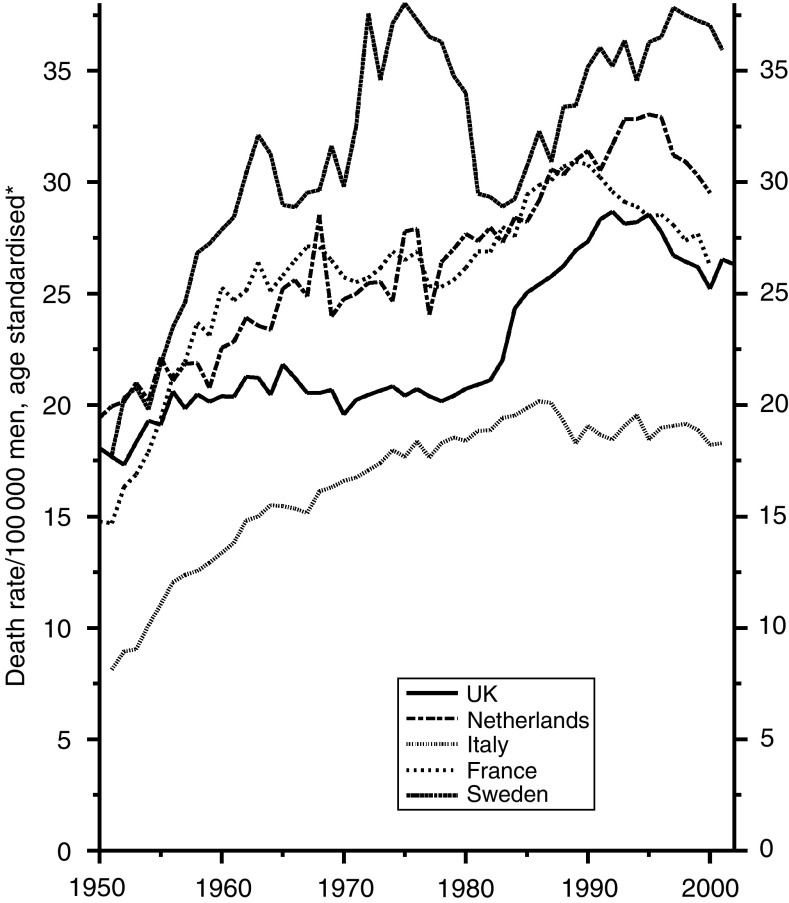
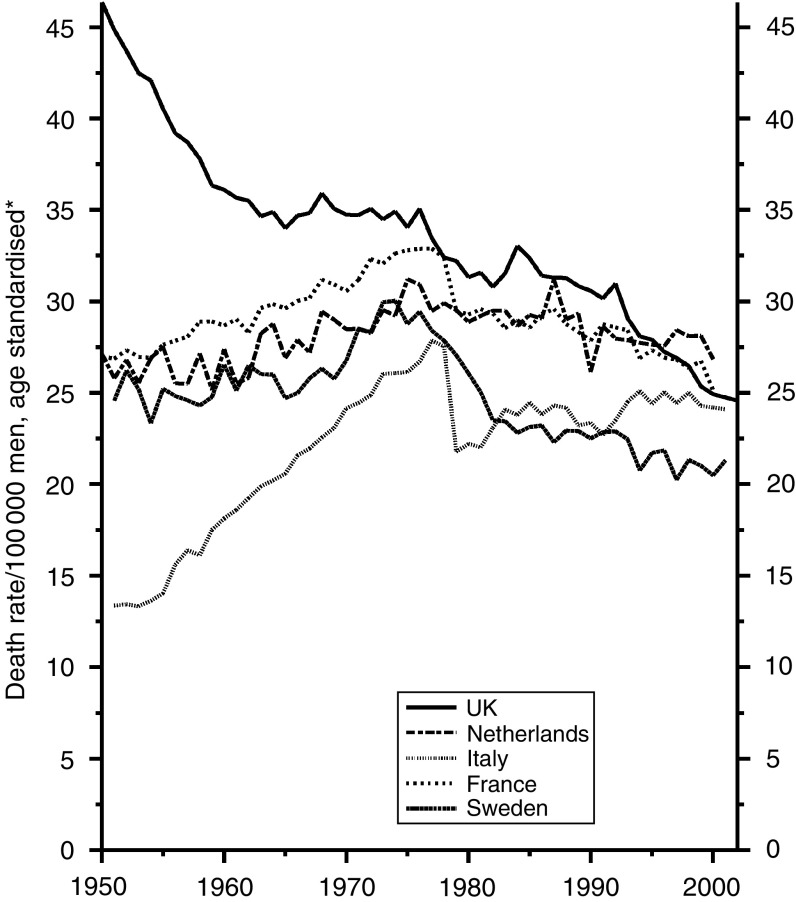
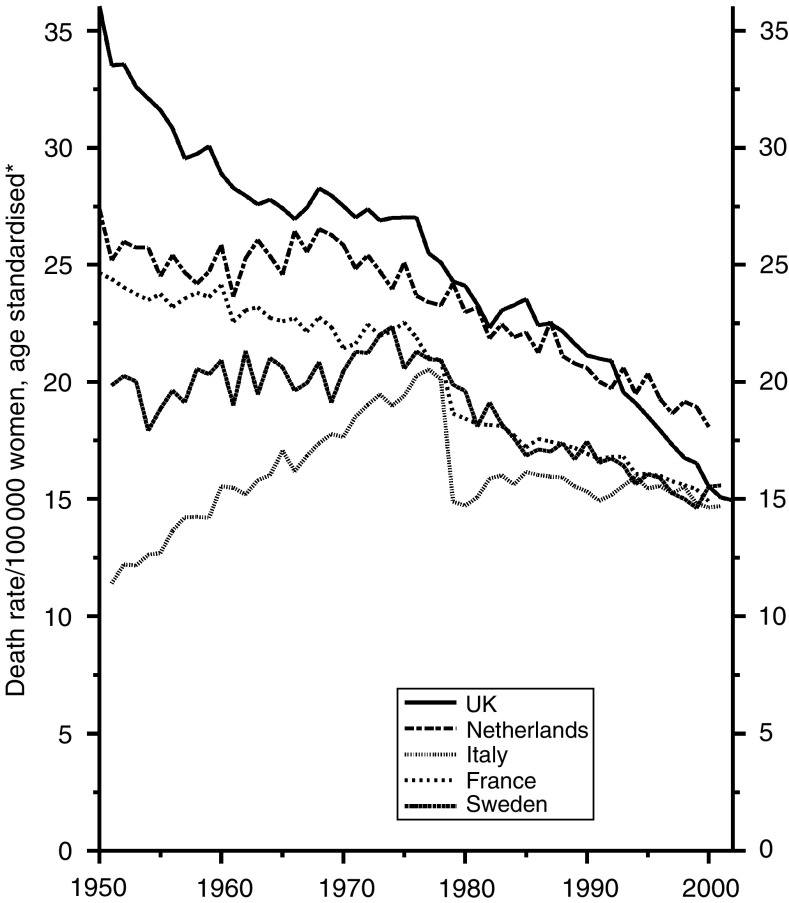
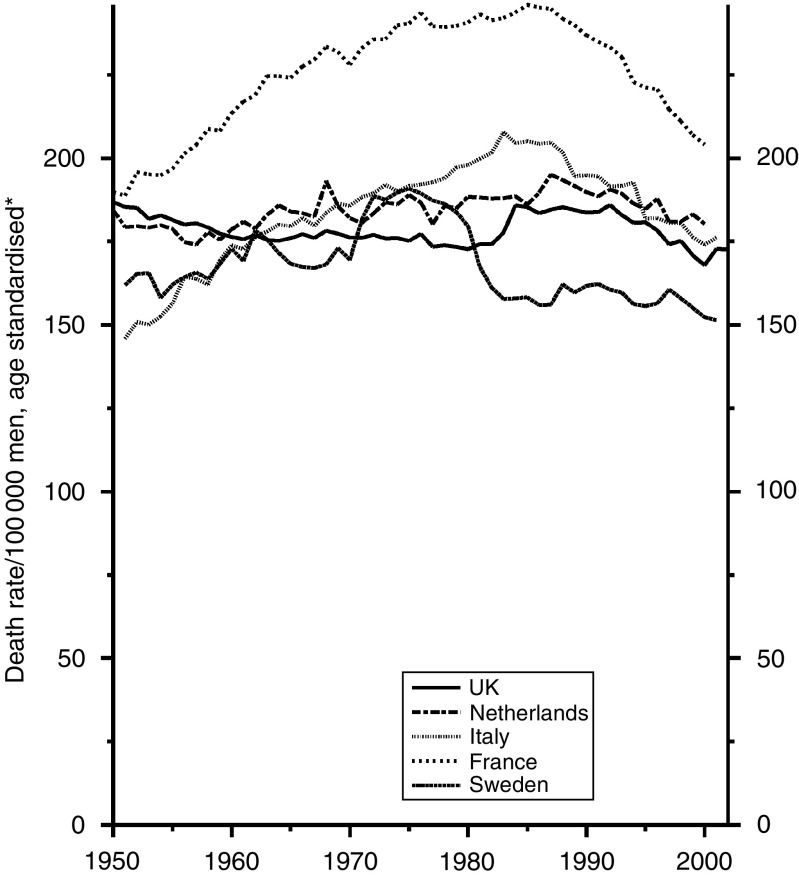
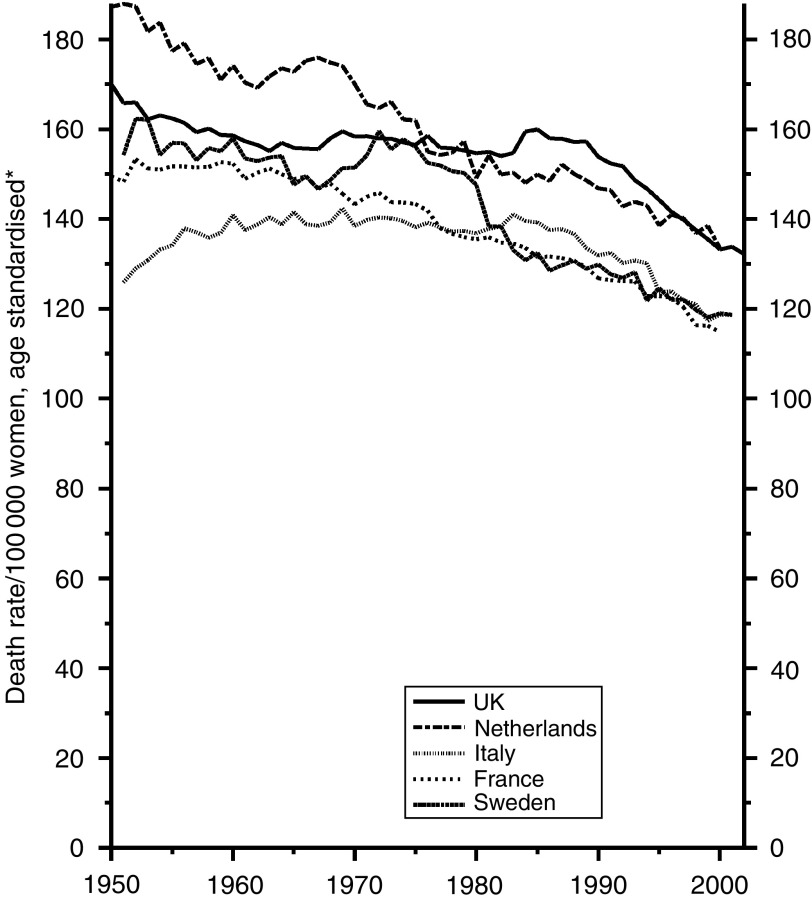
Comparisons of survival rates of given diseases with different treatments or in different places often gave misleading results until the introduction of controlled trials. Recent reports of relatively low survival rates following the treatment of cancer in the UK compared to the rates in other countries, not based on controlled trials, may consequently be misleading. Their validity has, therefore, been tested by comparing the levels and trends in mortality--the ultimate criterion by which the success or failure of any system of care can be judged. For this purpose, rates and trends in rates over 20-50 years have been compared in five European countries of similar economic status (France, Italy, the Netherlands, Sweden, and the UK). The UK rates are not generally worse than those in the other countries and are sometimes better. Exceptions were cancer of the lung, large bowel, and breast, the first of which is explained by differences in the prevalence of smoking.
Figures
Similar articles
-
Italian cancer figures, report 2012: Cancer in children and adolescents.Epidemiol Prev. 2013 Jan-Feb;37(1 Suppl 1):1-225. Epidemiol Prev. 2013. PMID: 23585445 English, Italian.
-
High cancer mortality rates in the elderly in the UK.Cancer Epidemiol. 2011 Oct;35(5):407-12. doi: 10.1016/j.canep.2011.05.015. Epub 2011 Aug 17. Cancer Epidemiol. 2011. PMID: 21852216
-
Recent trends of cancer in Europe: a combined approach of incidence, survival and mortality for 17 cancer sites since the 1990s.Eur J Cancer. 2008 Jul;44(10):1345-89. doi: 10.1016/j.ejca.2007.12.015. Epub 2008 Feb 14. Eur J Cancer. 2008. PMID: 18280139
-
Trends in lung cancer among young European women: the rising epidemic in France and Spain.Int J Cancer. 2007 Jul 15;121(2):462-5. doi: 10.1002/ijc.22694. Int J Cancer. 2007. PMID: 17373662
-
Closing the gap: cancer in Central and Eastern Europe (CEE).Eur J Cancer. 2008 Jul;44(10):1425-37. doi: 10.1016/j.ejca.2008.02.014. Epub 2008 Mar 20. Eur J Cancer. 2008. PMID: 18358713
Cited by
-
Health Care Accessibility and Breast Cancer Mortality in Europe.Int J Environ Res Public Health. 2022 Oct 20;19(20):13605. doi: 10.3390/ijerph192013605. Int J Environ Res Public Health. 2022. PMID: 36294189 Free PMC article. Review.
-
Are UK cancer cure rates worse than in most other European countries?Br J Gen Pract. 2010 Feb;60(571):81-2. doi: 10.3399/bjgp10X483102. Br J Gen Pract. 2010. PMID: 20132700 Free PMC article. No abstract available.
-
Comparing cancer and cardiovascular disease trends in 20 middle- or high-income countries 2000-19: A pointer to national trajectories towards achieving Sustainable Development goal target 3.4.Cancer Treat Rev. 2021 Nov;100:102290. doi: 10.1016/j.ctrv.2021.102290. Epub 2021 Sep 9. Cancer Treat Rev. 2021. PMID: 34536729 Free PMC article. Review.
-
Attitude of the Italian general population towards prevention and screening of the most common tumors, with special emphasis on colorectal malignancies.Intern Emerg Med. 2009 Jun;4(3):213-20. doi: 10.1007/s11739-008-0184-5. Epub 2008 Sep 20. Intern Emerg Med. 2009. PMID: 18807148
References
-
- Early Breast Cancer Trialists' Collaborative Group (1988) Effects of adjuvant tamoxifen and of cytotoxic therapy on mortality in early breast cancer. New Engl J Med 319: 1681–1692 - PubMed
-
- International Agency for Research on Cancer (1992) In Cancer Incidence in Five Continents Parkin DM, Miur CS, Whelan SL, Gao Y-T, Ferlay J, Powell J (eds), Vol 6 International Agency for Research on Cancer: Lyon, 1992
-
- Sant M, Aareleid T, Berrino F, Bielska LM, Carli PM, Faivre J, Grosclaude P, Hedelin G, Matsuda T, Moller H, Moller T, Verdecchia A, Capocaccia R, Gatta G, Micheli A, Santaquilani M, Roazzi P, Lisi D (2003) EUROCARTE-3 survival of cancer patients diagnosed 1990–94-results and commentary. Ann Oncol 14(Suppl 5): v61–v118 - PubMed
Publication types
MeSH terms
LinkOut - more resources
Full Text Sources
