Comparative Study
. 2005 Apr 5;102(14):5174-9.
doi: 10.1073/pnas.0501140102. Epub 2005 Mar 23.

The complete genomes and proteomes of 27 Staphylococcus aureus bacteriophages

Affiliations
Comparative Study

The complete genomes and proteomes of 27 Staphylococcus aureus bacteriophages

Tony Kwan et al. Proc Natl Acad Sci U S A. .

Abstract

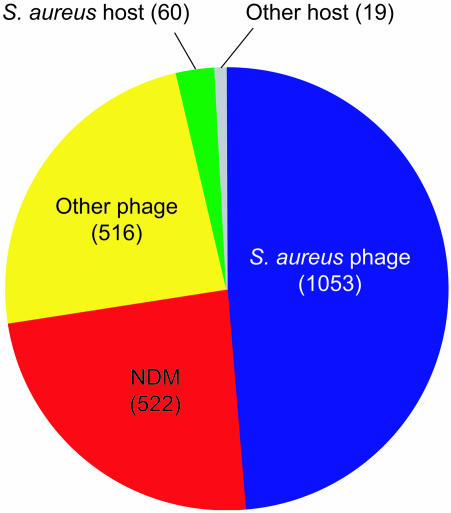
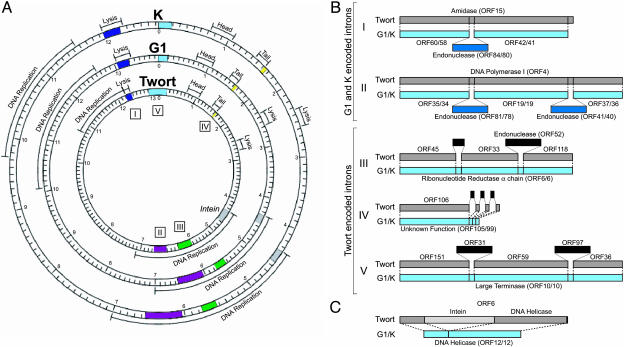
Bacteriophages are the most abundant life forms in the biosphere. They play important roles in bacterial ecology, evolution, adaptation to new environments, and pathogenesis of human bacterial infections. Here, we report the complete genomic sequences, and predicted proteins of 27 bacteriophages of the Gram-positive bacterium Staphylococcus aureus. Comparative nucleotide and protein sequence analysis indicates that these phages are a remarkable source of untapped genetic diversity, encoding 2,170 predicted protein-encoding ORFs, of which 1,402 cannot be annotated for structure or function, and 522 are proteins with no similarity to other phage or bacterial sequences. Based on their genome size, organization of their gene map and comparative nucleotide and protein sequence analysis, the S. aureus phages can be organized into three groups. Comparison of their gene maps reveals extensive genome mosaicism, hinting to a large reservoir of unidentified S. aureus phage genes. Among the phages in the largest size class (178-214 kbp) that we characterized is phage Twort, the first discovered bacteriophage (responsible for the Twort-D'Herelle effect). These phage genomes offer an exciting opportunity to discern molecular mechanisms of phage evolution and diversity.


Figures

Fig. 1.
Fig. 1.
Bacteriophage genomics. Distribution illustrating relationship of S. aureus bacteriophage proteome to current entries in GenBank Bacteria and Phage databases. The number of bacteriophage proteins with homology (blast E value cutoff = 10–4) to another S. aureus bacteriophage (blue), other bacteriophages (yellow), to the S. aureus genome (green), to other hosts (gray), or NDM (red) is indicated in parentheses.
Fig. 2.
Fig. 2.
Comparative nucleotide sequence analysis of S. aureus bacteriophages genomes. Shown is a dot matrix comparing the relatedness of the nucleotide sequences of each phage genome that were generated with the software program dotter (32) by using a sliding window of 25 bp.
Fig. 3.
Fig. 3.
Comparative gene arrangements among S. aureus bacteriophage head regions. The gene content of each phage head region and identity of the encoded proteins are indicated by colored boxes, using the same color key as described for Fig. 1. The map location of each head region is indicated and the annotation is aligned such that the leftmost part of the gene is directly below the start of the text. Genes lacking annotation have no predicted function. Note that for PT1028, no head region was identified from the structural ORF map.
Fig. 4.
Fig. 4.
Mosaicism in S. aureus phages. (A) A highly mosaic segment of one of the DNA-replication modules of phages G1 and K. Related ORFs are identified by using a color code, with the percent identity shown to the left of bacteriophage K ORFs. Nonhomologous regions are evident on the dot matrix because they result in discontinuity of the diagonal plot and are shaded gray. None of the ORFs within this region, with the exception of G1 ORF 85 (HNH endonuclease) encode proteins with known function. (B) Mosaic nature of phage 47. The nucleotide sequence of phage 47 was scanned for conserved blocks of ≥50 bp showing≥98% identity with the other 26 S. aureus phages (identified to the left). Identified regions are aligned below the white box that schematically represents phage 47.
Fig. 5.
Fig. 5.
Splicing within Twort, G1, and K. (A) Circular map of phages K, G1, and Twort, illustrating the relative location of the regions involved in splicing. (B) Introns present in the G1, K, and Twort genomes. Intervening sequences are indicated above or below the denoted ORFs in dark blue. The five regions compared for conservation of splicing events are numbered I–V. (C) Schematic representation illustrating the predicted presence of an intein within Twort ORF 6. The intein is denoted by a lightly shaded gray box. The predicted downstream extein has putative DNA helicase activity (blast E value = 10–34).

Similar articles

Cited by

References

    1. Wommack, K. E. & Colwell, R. R. (2000) Microbiol. Mol. Biol. Rev. 64, 69–114. - PMC - PubMed
    1. Wilhelm, S. W., Brigden, S. M. & Suttle, C. A. (2002) Microb. Ecol. 43, 168–173. - PubMed
    1. Breitbart, M., Wegley, L., Leeds, S., Schoenfeld, T. & Rohwer, F. (2004) Appl. Environ. Microbiol. 70, 1633–1640. - PMC - PubMed
    1. Pedulla, M. L., Ford, M. E., Houtz, J. M., Karthikeyan, T., Wadsworth, C., Lewis, J. A., Jacobs-Sera, D., Falbo, J., Gross, J., Pannunzio, N. R., et al. (2003) Cell 113, 171–182. - PubMed
    1. Breitbart, M., Salamon, P., Andresen, B., Mahaffy, J. M., Segall, A. M., Mead, D., Azam, F. & Rohwer, F. (2002) Proc. Natl. Acad. Sci. USA 99, 14250–14255. - PMC - PubMed

Publication types