Comparative Study
. 2005 Mar 23;25(12):3086-94.
doi: 10.1523/JNEUROSCI.4433-04.2005.

The retrograde spread of synaptic potentials and recruitment of presynaptic inputs

Affiliations
Comparative Study

The retrograde spread of synaptic potentials and recruitment of presynaptic inputs

Brian L Antonsen et al. J Neurosci. .

Abstract

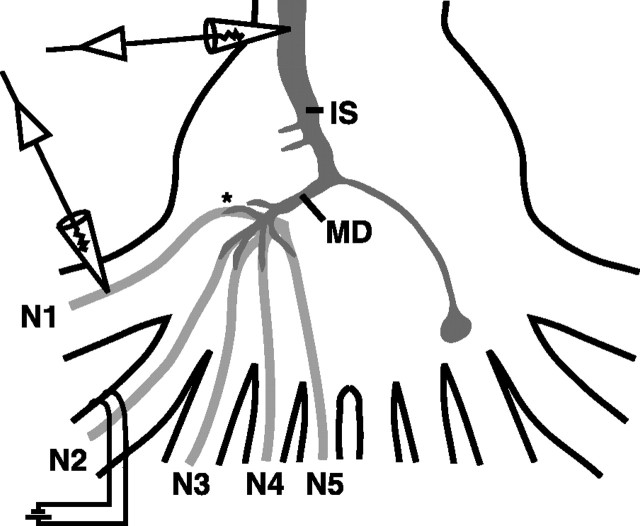
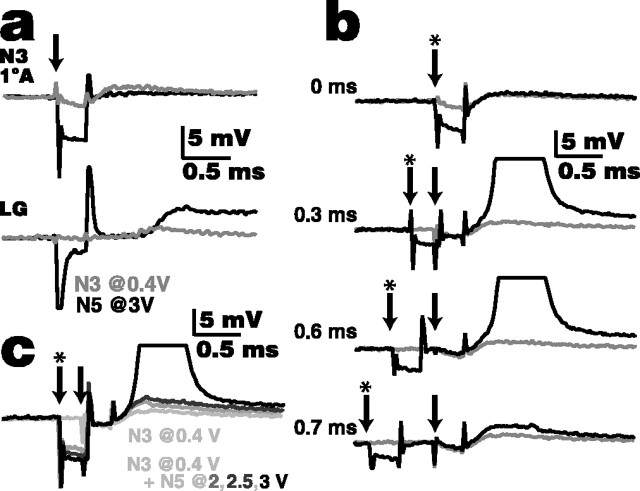
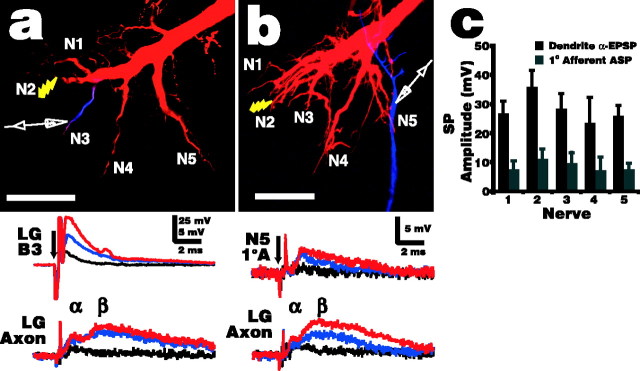
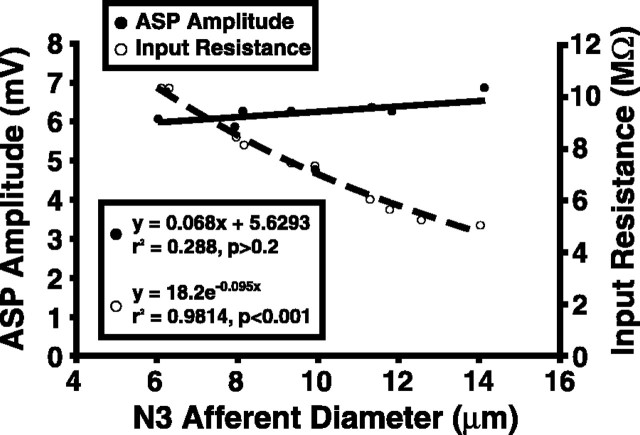
Lateral excitation is a mechanism for amplifying coordinated input to postsynaptic neurons that has been described recently in several species. Here, we describe how a postsynaptic neuron, the lateral giant (LG) escape command neuron, enhances lateral excitation among its presynaptic mechanosensory afferents in the crayfish tailfan. A lateral excitatory network exists among electrically coupled tailfan primary afferents, mediated through central electrical synapses. EPSPs elicited in LG dendrites as a result of mechanosensory stimulation spread antidromically back through electrical junctions to unstimulated afferents, summate with EPSPs elicited through direct afferent-to-afferent connections, and contribute to recruitment of these afferents. Antidromic potentials are larger if the afferent is closer to the initial input on LG dendrites, which could create a spatial filtering mechanism within the network. This pathway also broadens the temporal window over which lateral excitation can occur, because of the delay required for EPSPs to spread through the large LG dendrites. The delay allows subthreshold inputs to the LG to have a priming effect on the lateral excitatory network and lowers the threshold of the network in response to a second, short-latency stimulus. Retrograde communication within neuronal pathways has been described in a number of vertebrate and invertebrate species. A mechanism of antidromic passage of depolarizing current from a neuron to its presynaptic afferents, similar to that described here in an invertebrate, is also present in a vertebrate (fish). This raises the possibility that short-term retrograde modulation of presynaptic elements through electrical junctions may be common.


Figures

Figure 1.
Figure 1.
A schematic of the experimental preparation is shown. Stimulating suction electrodes were placed on peripheral nerves as described in Materials and Methods and Results for each experiment (N2 shown). Intracellular recording electrodes in the LG were placed in the initial segment (IS), major dendrite (MD), or in the dendrites near afferent contact points (asterisk). Intracellular recordings from afferents were made near the base of the nerve root where it enters the ganglion (arrows) or near the afferent-LG contacts in the neuropile (asterisk).
Figure 2.
Figure 2.
Stimulation of one nerve (N5 in this example) enhances lateral excitation in a distant nerve (N3). a, Responses of an N3 afferent and LG to 0.3 ms shocks of N3 (0.4 V; gray traces) and to shocks of N5 (3 V; black traces). N3 shock elicits an ∼2 mV potential in the afferent axon, recorded in the nerve root, whereas N5 shock elicits a very small (<0.5 mV) potential. Both shocks elicit an EPSP in the LG at the initial segment, although the N5 shock, being larger, elicits the larger response. The arrow indicates the onset of the nerve shocks. b, Lateral excitation is enhanced if N5 shock precedes N3 shock within a discrete, short-latency window. The gray traces are the N3 (0.4V) shocks alone, black traces are the N3 plus N5 (3V) shocks together at different latencies, the arrows indicate the onset of the N3 shock, and the arrows with asterisks indicate the onset of the N5 shock (latency between shocks is given on each trace). There was no enhancement of the potential if the two shocks were delivered simultaneously (top trace). In this example, the N3 afferent was recruited only if the N5 stimulus preceded the N3 stimulus by 0.3-0.6 ms (middle two traces). Outside this range, some enhancement of the response recorded in the N3 afferent occurred between 0.2 and 0.8 ms latency (e.g., bottom trace, 0.7 ms). c, Enhancement of lateral excitation depends on the strength of the previous stimulus. With the N3 (0.4 V) shock (arrow) following the N5 shock (arrow with an asterisk) with the optimal 0.3 ms latency, it required a strong (3 V) N5 shock to recruit the afferent (black trace). Lower-voltage shocks to N5 enhanced the potential recorded in the afferent (dark gray traces) over the response from N3 shock alone (light gray trace, lowest response) but did not result in recruitment. All experiments were from the same preparation and cells.
Figure 3.
Figure 3.
Electrotonic spread of LG EPSPs into neighboring dendrites and antidromically into their presynaptic afferents. a, In this example, N2 was shocked, whereas intracellular recording electrodes were placed in the LG initial segment and the LG dendrite branch contacting N3 afferents. The micrograph illustrates the relative locations of the stimulus and the dendrite recording electrode, whereas the traces demonstrate that a very large EPSP was recorded in the N3 branch (LG B3) in response to subthreshold N2 shocks at 1 V (black), 1.3 V (blue), and 1.5 V (red; 70% of the LG threshold). The electrode in the initial segment (LG Axon) recorded the typical, much-lower-amplitude biphasic LG EPSPs (α and β component labeled), demonstrating that although high-amplitude EPSPs are maintained in the dendrites, there is substantial decay in the α component before they reach the initial segment. b, Similar setup as in a, except that the second recording electrode was placed in an N5 primary afferentrather than the N3 LG branch (micrograph). Small shocks to N2 (0.8 V in this example, black trace) that elicit a small EPSP at the LG initial segment do not elicit a detectable ASP in afferents in other nerves. Larger shocks (blue, 1.0 V; red, 1.5 V, 70% of the LG threshold) do elicit afferent ASPs, and these reflect the time course of the LG dendrite EPSPs fairly closely with a short delay. In a and b, the LG was filled with TR and NB (data not shown for clarity), and the recording site was identified by injecting Cascade Blue. The arrows indicate stimulus onset. Scale bars, 100 μm. c, Average synaptic potential (SP) amplitude, with SD, of primary afferent ASPs from each sensory nerve and EPSPs from the corresponding LG dendrites, evoked by N2 shock at 70% of the LG stimulus threshold (n = 6 for each). Afferent ASPs in N2 were not distinguishable from EPSPs elicited from direct afferent-afferent connections; therefore, the amplitudes given here represent the sum result of these two pathways.
Figure 4.
Figure 4.
Antidromic synaptic potential amplitude in N3 primary afferents in response to N2 shocks is not dependent on afferent size, measured as axon diameter. Input resistances and ASP sizes were measured from 10 afferents, ranging in size from 6 to 14 μm. Although input resistance decreased with larger size as expected, ASP amplitude did not change significantly.
Figure 5.
Figure 5.
Sensory nerve shock increases NB dye coupling from the LG to primary afferents in A6. The LG was injected with a pair of tracers, TR (red) and NB (green), which combined to make the LG appear yellow; cells that dye couple to the LG appear green. a, A preparation in which the LG was filled with the tracers but no additional stimulus was applied. The LG dendrites can be seen at the top of the micrograph, and the somata of dye-coupled motor neurons appear bright green [see Antonsen and Edwards (2003) for complete details of the anatomy]. The axons of primary afferents that dye coupled to the LG can be seen entering the ganglion from each peripheral nerve (asterisks), but they are quite faint in unstimulated preparations. b, Within a single preparation, NBF of afferents relative to LG was highly consistent independent of the location of the afferent (nerve). Afferents are plotted in the order they were measured and are color-coded to their nerve. See Materials and Methods for details on calculating relative afferent fluorescent intensity. c, Afferents appear much brighter in preparations that have been stimulated with N2 shocks; in this example, 20 Hz stimulation was applied for 10 min at an amplitude of 70% of the LG threshold voltage. d, Dye coupling between afferents in all nerves and the LG increased significantly with the frequency of N2 stimulation (Kruskal-Wallis test; p < 0.001 for each nerve). Points show means ± SD (n = 6). e, Relative afferent NBF intensity remained consistent among afferents of any given nerve after stimulation. This example is from a single preparation stimulated at 50 Hz. f, In the same preparation, relative afferent NBF intensity did not depend on afferent size (axon diameter). g, Intracellular recordings from the major dendrite of the LG near the initial segment show that the α component of the LG EPSP evoked by 20 Hz N2 stimulation remained constant over the stimulus period (times given are from start of stimulation), whereas the later β EPSP components quickly depress. This pattern was similar for each stimulus frequency. The arrows indicate the beginning of the stimulus, although the artifacts are too small to see on these traces. Scale bars, 50 μm.
Figure 6.
Figure 6.
Stimulation of single N3 afferents at 5 Hz for 10 min increased LG dye coupling with neighboring afferents. Both the number of affected neighboring afferents and the distance over which the effect was detected, measured as distance along LG dendrites between the contact points of the stimulated and affected afferents, increased with increasing size of the stimulated afferent. a, A confocal photomicrograph of A6 showing the effect of stimulation of a single N3 afferent (filled with 3000 MW Cascade Blue; blue arrowhead) on NB (green) dye coupling from the LG to neighboring afferents. The area outlined by the dashed box is enlarged in the inset. In this case, five neighboring afferents had a detectable increase in relative NBF (white dots in inset). All of the afferents converge onto the LG in close proximity to the stimulated afferent (asterisk in inset). The process indicated by the arrow is a primary neurite of a motor neuron, the cell body of which is not within this stack of slices. The LG was injected with NB and TR. Scale bars: 50 μm; inset, 10 μm. b, Graph showing the number of afferents with detectable increases in relative NBF (left ordinate) and the greatest distance from the stimulated afferent along LG dendrites over which the effect could be detected (right ordinate) as functions of the size of the stimulated afferent. Both the number of affected afferents and the distance over which the effect occurs increase with stimulated afferent size.

Similar articles

Cited by

References

    1. Antonsen BL, Edwards DH (2003) Differential dye coupling reveals lateral giant escape circuit in crayfish. J Comp Neurol 466: 1-13. - PubMed
    1. Araki M, Nagayama T (2003) Direct chemically mediated synaptic transmission from mechanosensory afferents contributes to habituation of crayfish lateral giant escape reaction. J Comp Physiol [A] 189: 731-739. - PubMed
    1. Bryan JS, Krasne FB (1977) Presynaptic inhibition: the mechanism of protection from habituation of the lateral giant fibre escape response. J Physiol (Lond) 271: 369-390. - PMC - PubMed
    1. Calabrese RL (1976) Crayfish mechanoreceptive interneurons. Part 1. The nature of ipsilateral excitatory inputs. J Comp Physiol [A] 105: 83-102.
    1. Cuntz H, Haag J, Borst A (2003) Neural image processing by dendritic networks. Proc Natl Acad Sci USA 100: 11082-11085. - PMC - PubMed

Publication types

MeSH terms

LinkOut - more resources