. 2005 Mar 24:6:70.
doi: 10.1186/1471-2105-6-70.

Paircomp, FamilyRelationsII and Cartwheel: tools for interspecific sequence comparison

Affiliations

Paircomp, FamilyRelationsII and Cartwheel: tools for interspecific sequence comparison

C Titus Brown et al. BMC Bioinformatics. .

Abstract

Background: Comparative sequence analysis is an effective and increasingly common way to identify cis-regulatory regions in animal genomes.

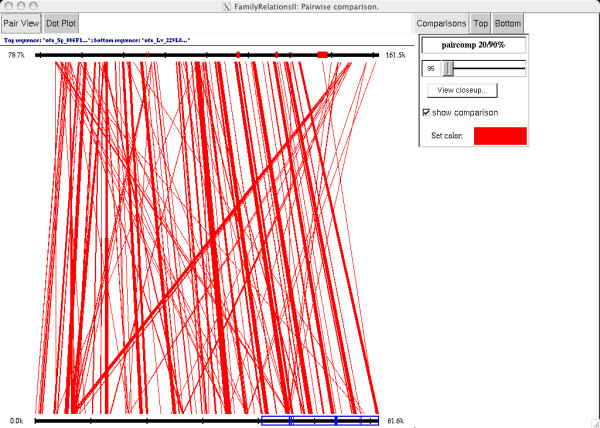
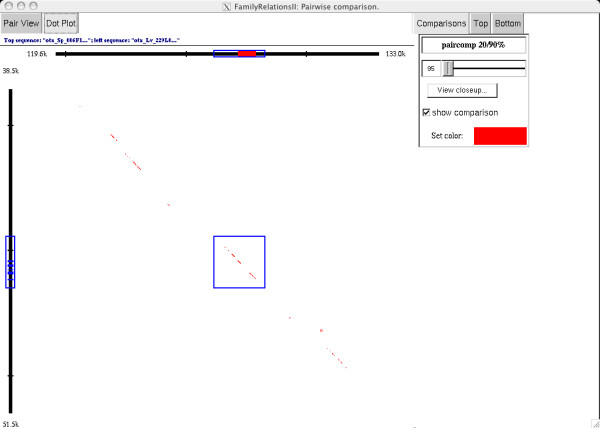
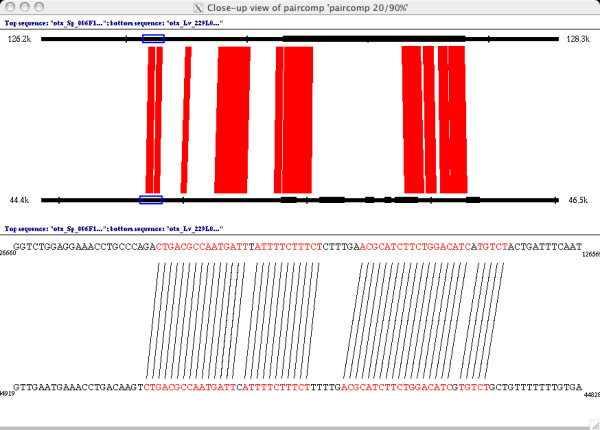
Results: We describe three tools for comparative analysis of pairs of BAC-sized genomic regions. Paircomp is a tool that does windowed (ungapped) comparisons of two sequences and reports all matches above a set threshold. FamilyRelationsII is a graphical viewer for comparisons that enables interactive exploration of several different kinds of comparisons. Cartwheel is a Web site and compute-cluster management system used to execute and store comparisons for display by FamilyRelationsII. These tools are specialized for the discovery of cis-regulatory regions in animal genomes. All tools and their source code are freely available at http://family.caltech.edu/.

Conclusion: These tools have been shown to effectively identify regulatory regions in echinoderms, mammals, and nematodes.


Figures

Figure 1
Figure 1
A paircomp comparison of the otx gene locus from S. purpuratus (top) with L. variegatus (bottom). We used paircomp to compare all 20 bp subsequences from a 160 kb S. purpuratus BAC with a 62 kb L. variegatus BAC; those 20 bp subsequences with a exact match of 19/20 or 20/20 bases are connected with a red line. Only the 80 kb surrounding the otx gene is shown on the top. Matches to the known S. purpuratus cDNA sequence are shown in red on the top sequence, and TBLASTX matches in L. variegatus to the same cDNA sequence are shown in blue on the bottom sequence. The L. variegatus genomic sequence does not extend to cover the 3' region of the coding sequence. On the top of the view are tabs to switch between the "pair view" (shown) and the "dot plot" view (see Figure 2). On the right side of the view are control buttons that allow the user to change both the color and the threshold at which matches are displayed. The user can also view a closeup of a region by selecting the region on the sequence (e.g. as on the bottom sequence, where a region from 40 kb to 61.6 kb is selected) and then pressing the "View closeup..." button. An example closeup view is shown in Figure 3.
Figure 2
Figure 2
A "dot-plot" style view of a subregion of the otx comparison (see Figure 1). The top sequence is a zoomed-in view of the otx genomic region from S. purpuratus, as in Figure 1; the region runs from 119.6 kb to 133.0 kb. The side sequence is a zoomed-in view of the orthologous region from L. variegatus, running from 38.5 kb to 51.5 kb. The region surrounding the first exon (in red) of the sp α-otx transcript is selected on the top (S. purpuratus) sequence, and the corresponding TBLASTX matches are highlighted on the left (L. variegatus) sequence in blue. The selection box in the center of the view contains the paircomp matches in this region, showing only 20 bp matches that match at 19/20 or 20/20 (corresponding to a 95% threshold). A closeup view of this region, showing the DNA sequence of the two regions with the corresponding matches, is shown in Figure 3.
Figure 3
Figure 3
A closeup view of the paircomp comparison of the genomic sequence surrounding the first exon of otx in S. purpuratus (top sequence) and L. variegatus (bottom sequence). The top half of the closeup view shows orthologous 2 kb genomic regions (126.2 kb – 128.3 kb in the S. purpuratus BAC, 44.4 kb – 46.5 kb in the L. variegatus BAC). Matches of 19/20 or 20/20 bases are drawn in red between the sequences, and the exon matches from Figure 2 are shown in black on the sequence lines. The bottom half of the closeup view shows the part of the sequence selected in blue on the top half of the view. Lines are drawn in black between individual matching bases, and the matching bases are colored in red. Note that both blocks shown match at 19/20 because of the single mismatch in the middle of the blocks.

References

    1. Cooper GM, Sidow A. Genomic regulatory regions: insights from comparative sequence analysis. Curr Opin Genet Dev. 2003;13:604–610. doi: 10.1016/j.gde.2003.10.001. - DOI - PubMed
    1. Brown CT, Rust AG, Clarke PJ, Pan Z, Schilstra MJ, De Buysscher T, Griffin G, Wold BJ, Cameron RA, Davidson EH, Bolouri H. New computational approaches for analysis of cis-regulatory networks. Dev Biol. 2002;246:86–102. doi: 10.1006/dbio.2002.0619. - DOI - PubMed
    1. Yuh CH, Brown CT, Livi CB, Rowen L, Clarke PJ, Davidson EH. Patchy interspecific sequence similarities efficiently identify positive cis-regulatory elements in the sea urchin. Dev Biol. 2002;246:148–161. doi: 10.1006/dbio.2002.0618. - DOI - PubMed
    1. Kirouac M, Sternberg PW. cis-Regulatory control of three cell fate-specific genes in vulval organogenesis of Caenorhabditis elegans and C. briggsae. Dev Biol. 2003;257:85–103. doi: 10.1016/S0012-1606(03)00032-0. - DOI - PubMed
    1. Romano LA, Wray GA. Conservation of Endo16 expression in sea urchins despite evolutionary divergence in both cis and trans-acting components of transcriptional regulation. Development. 2003;130:4187–4199. doi: 10.1242/dev.00611. - DOI - PubMed

Publication types

MeSH terms

LinkOut - more resources