. 2005 Apr 5;102(14):5050-5.
doi: 10.1073/pnas.0407763102. Epub 2005 Mar 24.

A long-range attraction between aggregating 3T3 cells mediated by near-infrared light scattering

Affiliations

A long-range attraction between aggregating 3T3 cells mediated by near-infrared light scattering

Guenter Albrecht-Buehler. Proc Natl Acad Sci U S A. .

Abstract

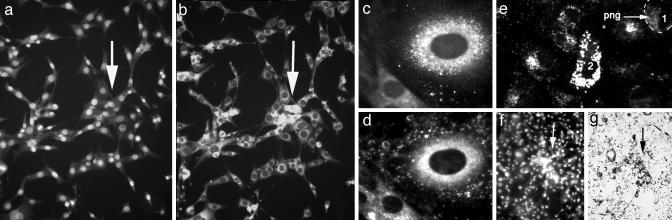
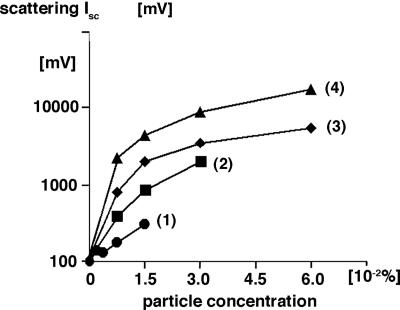
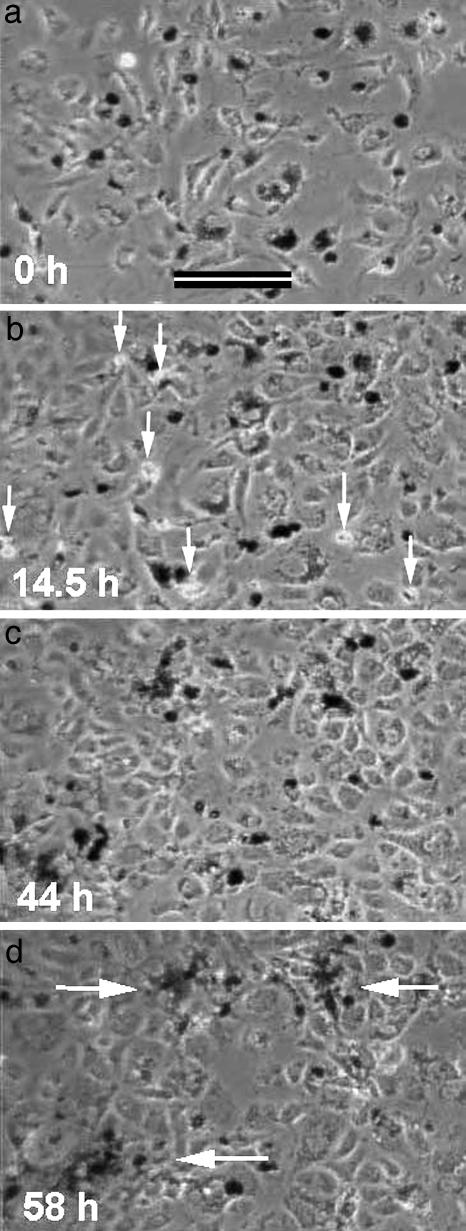
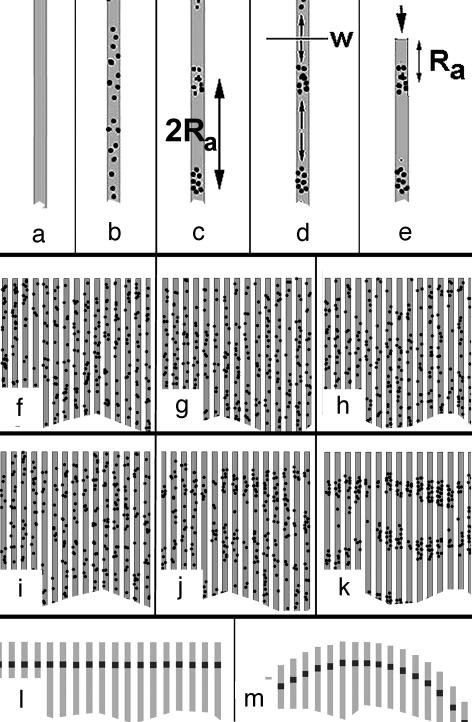
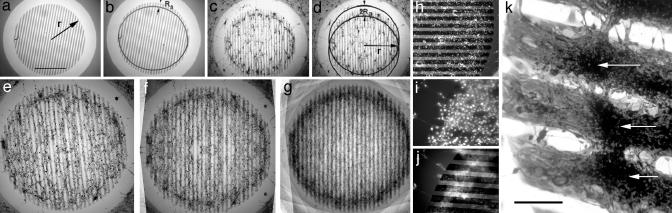
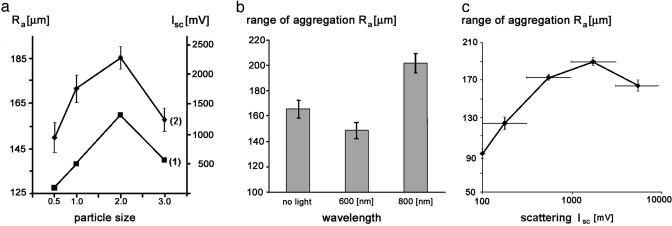
At what range can a mammalian cell sense the presence of another cell and through what medium? To approach these questions, the formation of aggregates of a 3T3 cell variant (3T3x cells) grown on solid substrates was studied. Each of the aggregates consisted of cells that, at the time of their seeding, were single and located randomly. Yet somehow they seemed to detect each other within a certain range (R(a)) and move together to form aggregates. The article describes a simple assay to measure the value of R(a). When applied to 3T3x cells with altered intensities of near-infrared light scattering (I(sc)) the assay showed that (i) R(a) was much larger than one cell diameter, and (ii) R(a) was directly related to I(sc). The results suggest that near-infrared light scattering by the cells mediate a long-range attraction between them, which does not require physical contact and enables them to detect each other's presence.


Figures

Fig. 1.
Fig. 1.
Heuristics for a possible linkage between light scattering and aggregation. (a) Appearance of a typical aggregate of 3T3x cells (arrow) whose nuclei are stained with Hoechst dye. (b) The same aggregate stained with LysoTracker reveals that lysosome-rich cells are located at the center of the aggregate. (c) Lysosome staining of a 3T3 cell. (d) Darkfield micrograph of the same cell suggesting that the light-scattering centers of the cell contain the lysosomes. The dark ovals in c and d are the nuclei given that they do not scatter light and do not contain lysosomes. (e) Darkfield micrograph of a hyperscattering 3T3x (labeled 2) cell that was formed by the ingestion of strongly light-scattering, 1-μm, latex particles. The cell is surrounded by particle-free 3T3x cells (e.g., labeled 1) whose perinuclear granules (png) scatter much less light than the hyperscattering cell. (f) Hoechst staining of an aggregate of hyperscattering cells. (g) Brightfield micrograph of the same aggregate. The cells with the most ingested particles that appear the darkest because they scatter the most light are located at the center of the aggregate.
Fig. 2.
Fig. 2.
Standardized light scattering Isc of hyperscattering cells at 830 nm as a function of the concentration (wt/wt) of ingested particles of different materials Line 1, 1-μm latex particles; line 2, 2-μm latex particles; line 3, 1-μm dark diamond particles; line 4, 1-μm white diamond particles. The abscissa of the graph indicates particle concentration, and the ordinate indicates light scattering of particle-loaded cells measured as photomultiplier readings.
Fig. 3.
Fig. 3.
Time-lapse observation of the aggregation of hyperscattering cells mixed with particle-free 3T3x cells. The hyperscattering cells contained 1-μm latex particles and appear dark in phase contrast (low levels of 600-nm field illumination). White arrows in b point to several mitotic figures. White arrows in d point to final aggregates. The hyperscattering cells drew closer to each other long before they were able to make physical contact.
Fig. 4.
Fig. 4.
Assay to measure Ra (unidirectional assay of cell aggregation). (ae) Basic rationale. Different stages of the formation of the outermost aggregate a certain distance Ra away from the end of the strip (see text). (fk) Computer simulation of the formation of the outermost aggregates. [Simulation parameters: cell diameter, 5 pixels; strip width, 15 pixels; rounds of simulation: 0 (f and i), 40 (g and j), and 100 (h and k)]. (fh) Ra = 0. No aggregation occurred. (ik) Ra = 100. Formation of aggregates at a distance Ra away from the ends of the strips. The distance between aggregates on the same strip is ≈2Ra. (l) Predicted locations of the outermost aggregates (dark markings) on an array of parallel strips form a line parallel to the ends if the array is rectangular. (m) Predicted locations of the outermost aggregates (dark markings) on an array of parallel strips lie along a circle if the ends form a circle. This particular geometry is used in the present study.
Fig. 5.
Fig. 5.
Unidirectional aggregation of 3T3x cells. (a) Circular pattern of adhesive strips (gray areas) on a nonadhesive substrate (bright areas) generated by evaporating a thin layer of NiCr onto a Sylgard 184 surface with a bar pattern electron microscope grid as a mask (r = 1.25 mm). (Bar, 1 mm.) (b) According to the basic rationale, the outermost cell aggregates on each strip must be located a distance Ra away from each end. The two circular arcs indicate these locations. (c) Example of aggregates of hyperscattering cells located along the predicted aggregation arcs as seen in brightfield microscopy. (d) Quantitative evaluation of the circular aggregation arcs by matching them to two circles of radius r. The shift between the circles is 2Ra. Obviously, Ra is much larger than one cell diameter, suggesting that there is a long-range attraction between the aggregating cells. (eg) Increase of visibility and accuracy of the aggregation arcs by image averaging. (e) Unprocessed image. (f) Superimposition of e with its own mirror image (self-mirrored image). (g) Image average of all five test fields of a test substrate, each processed as in f.(h) Visualization of aggregation arcs in the case of low-level scattering of ingested particles. Arc formation of cells that had ingested 0.1-μm fluorescent latex particles. Even though the particles are too small to be detected in brightfield micrographs, the self-mirrored fluorescence micrograph shows the location of the outermost aggregates away from the ends of the adhesive strips. (i and j) Visualization of aggregation arcs in the case of particle-free 3T3x cells. (i) Hoechst staining of a field of particle-free cells. (j) LysoTracker staining of the same field reveals an aggregation arc formed by lysosome-rich cells. (k) Coomassie-blue-stained 3T3x cells that had formed aggregation arcs on the large and wide-spaced strips derived from a 100-mesh grid during the 5 days after they had ingested white diamond particles. White arrows point to the aggregates of particle-rich cells that constituted parts of the arc. Obviously, the sheet of particle-rich, aggregated cells did not retract under some kind of tension away from the ends of the strip but were embedded in a much larger cell sheet that covered the entire strip. (Bar, 150 μm.)
Fig. 6.
Fig. 6.
Quantitation of arc formation. (a) Parallels between the Isc of hyperscattering cells at 830 nm (line 1) and the Ra (line 2). The abscissa of the graph indicates the size of the latex particles used to generate the hyperscattering cells. The left-hand ordinate indicates the Ra of hyperscattering cells, and the right-hand ordinate indicates their Isc. Error bars indicate the error of the means of two independent experiments, with 10 measurements per data point. (b) Effect of continuous irradiation of hyperscattering cells with 12–15 μW/cm2 of light at a distance of 45 mm. The columns represent the average of 14 measurements of the Ra in three independent experiments. Error bars indicate the error of the mean. (c) Correlation between Ra and Isc of hyperscattering cells. Each data point represents the average of 20–45 individual measurements of Ra. Horizontal error bars indicate the size of the sorting intervals that yielded the indicated averages. Vertical error bars indicate the error of the mean of these averages.

References

    1. Albrecht-Buehler, G. (1991) J. Cell Biol. 114, 493–502. - PMC - PubMed
    1. Albrecht-Buehler, G. (1992) Proc. Natl. Acad. Sci. USA 89, 8288–8292. - PMC - PubMed
    1. Albrecht-Buehler, G. (1995) Cell Motil. Cytoskeleton 32, 299–304. - PubMed
    1. Albrecht-Buehler, G. (1998) Cell Motil. Cytoskeleton 40, 183–192. - PubMed
    1. Armstrong, P. B. (1989) Crit. Rev. Biochem. Mol. Biol. 24, 119–149. - PubMed

Publication types

LinkOut - more resources