

Can routine laboratory tests discriminate between severe acute respiratory syndrome and other causes of community-acquired pneumonia?
- PMID: 15791504
- PMCID: PMC7107805
- DOI: 10.1086/428577
Can routine laboratory tests discriminate between severe acute respiratory syndrome and other causes of community-acquired pneumonia?
Abstract
Background: The clinical presentation of severe acute respiratory syndrome (SARS) resembles that of other etiologies of community-acquired pneumonia, making diagnosis difficult. Hematological and biochemical abnormalities, particularly lymphopenia, are common in patients with SARS.
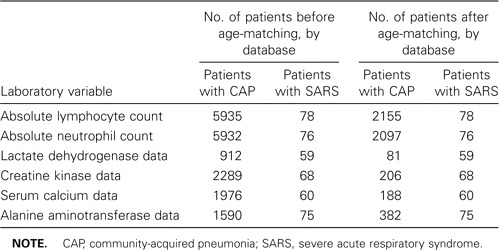
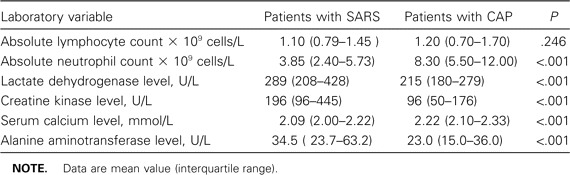
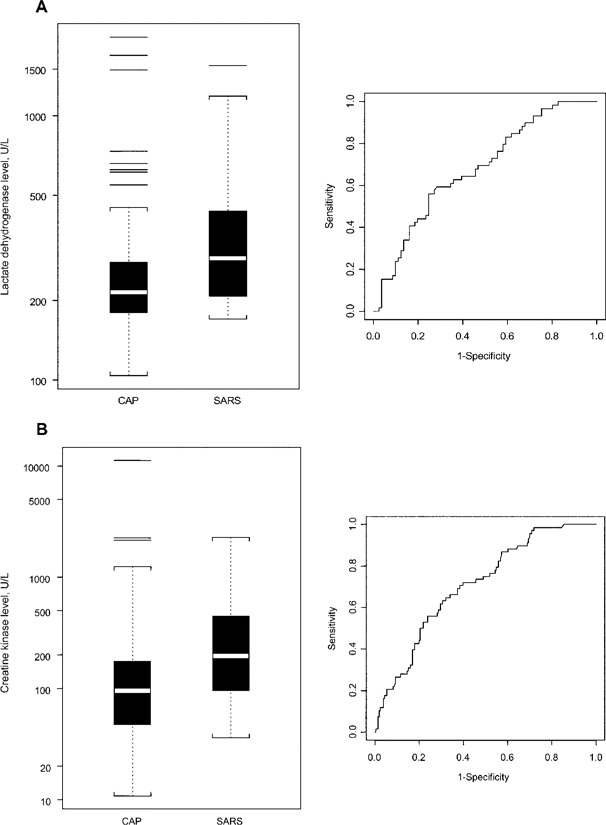
Methods: With the use of 2 databases, we compared the ability of the absolute lymphocyte count, absolute neutrophil count, lactate dehydrogenase level, creatine kinase level, alanine aminotransferase level, and serum calcium level at hospital admission to discriminate between cases of SARS and cases of community-acquired pneumonia. The SARS database contained data for 144 patients with SARS from the 2003 Toronto SARS outbreak. The community-acquired pneumonia database contained data for 8044 patients with community-acquired pneumonia from Edmonton, Canada. Patients from the SARS database were matched to patients from the community-acquired pneumonia database according to age, and receiver operating characteristic curves were constructed for each laboratory variable.
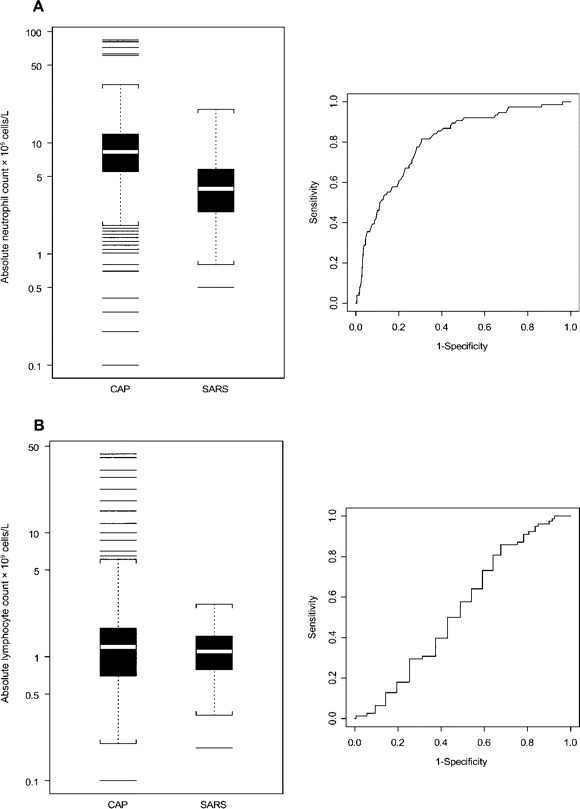
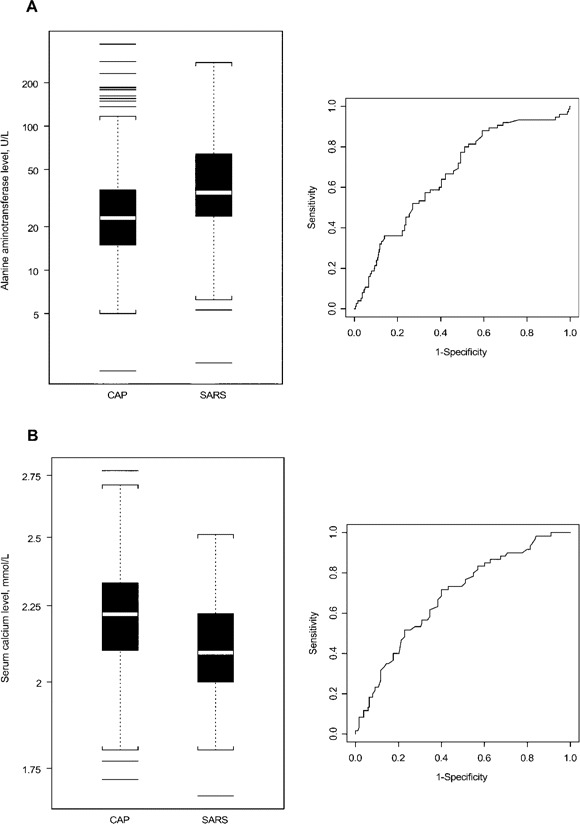
Results: The areas under the receiver operating characteristic curves (AUCs) demonstrated fair to poor discriminatory ability for all laboratory variables tested except absolute neutrophil count, which had an AUC of 0.80, indicating good discriminatory ability (although there was no cutoff value of the absolute neutrophil count at which reasonable sensitivity or specificity could be obtained). Combinations of any 2 tests did not perform significantly better than did the absolute neutrophil count alone.
Conclusions: Routine laboratory tests, including determination of absolute lymphocyte count, should not be used in the diagnosis of SARS or incorporated into current case definitions of SARS. The role of the absolute neutrophil count in SARS diagnosis is likely limited, but it should be assessed further.
Figures
Similar articles
-
A case-control study of SARS versus community acquired pneumonia.Arch Dis Child. 2005 Jul;90(7):747-9. doi: 10.1136/adc.2004.063446. Arch Dis Child. 2005. PMID: 15970619 Free PMC article.
-
Role of laboratory variables in differentiating SARS-coronavirus from other causes of community-acquired pneumonia within the first 72 h of hospitalization.Eur J Clin Microbiol Infect Dis. 2006 Dec;25(12):765-72. doi: 10.1007/s10096-006-0222-z. Eur J Clin Microbiol Infect Dis. 2006. PMID: 17077967 Free PMC article.
-
The Role of Neutrophil to Lymphocyte Count Ratio in the Differential Diagnosis of Pulmonary Tuberculosis and Bacterial Community-Acquired Pneumonia: a Cross-Sectional Study at Ayder and Mekelle Hospitals, Ethiopia.Clin Lab. 2019 Apr 1;65(4). doi: 10.7754/Clin.Lab.2018.180833. Clin Lab. 2019. PMID: 30969087
-
Severe acute respiratory distress syndrome (SARS): a critical care perspective.Crit Care Med. 2003 Nov;31(11):2684-92. doi: 10.1097/01.CCM.0000091929.51288.5F. Crit Care Med. 2003. PMID: 14605542 Review.
-
Point-of-care testing for community-acquired pneumonia: do we have all the answers?Med J Aust. 2007 Jul 2;187(1):40-2. doi: 10.5694/j.1326-5377.2007.tb01113.x. Med J Aust. 2007. PMID: 17605702 Review.
Cited by
-
Systematic review and meta-analysis protocol: Diagnostic accuracy assessment for soil-transmitted helminth using microscopy and molecular-based methods.MethodsX. 2024 Oct 1;13:102993. doi: 10.1016/j.mex.2024.102993. eCollection 2024 Dec. MethodsX. 2024. PMID: 39430782 Free PMC article.
-
Nuclear Magnetic Resonance (NMR)-Based Quantification on Flavor-Active and Bioactive Compounds and Application for Distinguishment of Chicken Breeds.Food Sci Anim Resour. 2021 Mar;41(2):312-323. doi: 10.5851/kosfa.2020.e102. Epub 2021 Mar 1. Food Sci Anim Resour. 2021. PMID: 33987551 Free PMC article.
-
Novel radiologic indices for stem type decision in total hip arthroplasty in patients with metaphyseo-diaphyseal mismatched Dorr A proximal femur.BMC Musculoskelet Disord. 2024 Feb 9;25(1):124. doi: 10.1186/s12891-024-07223-5. BMC Musculoskelet Disord. 2024. PMID: 38336653 Free PMC article.
-
Early diagnosis of SARS: lessons from the Toronto SARS outbreak.Eur J Clin Microbiol Infect Dis. 2006 Apr;25(4):230-7. doi: 10.1007/s10096-006-0127-x. Eur J Clin Microbiol Infect Dis. 2006. PMID: 16586072 Free PMC article.
-
Development and validation of new poisoning mortality score system for patients with acute poisoning at the emergency department.Crit Care. 2021 Jan 18;25(1):29. doi: 10.1186/s13054-020-03408-1. Crit Care. 2021. PMID: 33461588 Free PMC article.
References
-
- Centers for Disease Control and Prevention Outbreak of severe acute respiratory syndrome—worldwide, 2003. MMWR Morb Mortal Wkly Rep. 2003;52:226–8. - PubMed
-
- Ksiazek TG, Erdman D, Goldsmith CS, et al. A novel coronavirus associated with severe acute respiratory syndrome. N Engl J Med. 2003;348:1953–66. - PubMed
-
- Drosten C, Gunther S, Preiser W, et al. Identification of a novel coronavirus in patients with severe acute respiratory syndrome. N Engl J Med. 2003;348:1967–76. - PubMed
-
- Poutanen SM, Low DE, Henry B, et al. Identification of severe acute respiratory syndrome in Canada. N Engl J Med. 2003;348:1995–2005. - PubMed
Publication types
MeSH terms
Substances
LinkOut - more resources
Full Text Sources
Other Literature Sources
Medical
Miscellaneous
