. 2005 Jun;88(6):4319-36.
doi: 10.1529/biophysj.104.055319. Epub 2005 Mar 25.

Two-photon cross-correlation analysis of intracellular reactions with variable stoichiometry

Affiliations

Two-photon cross-correlation analysis of intracellular reactions with variable stoichiometry

Sally A Kim et al. Biophys J. 2005 Jun.

Abstract

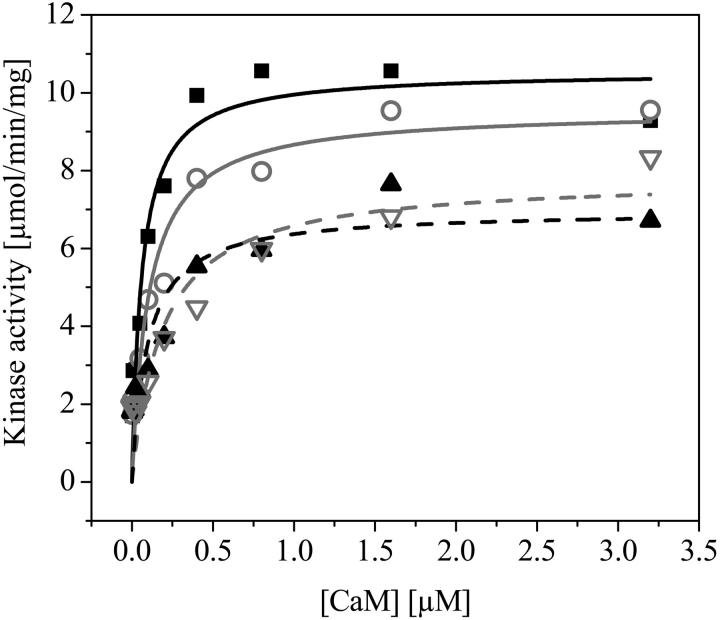
We successfully demonstrate the effectiveness of two-photon fluorescence cross-correlation spectroscopy (TPCCS) to study the complex binding stoichiometry of calmodulin (CaM) and Ca(2+)/CaM-dependent protein kinase II (CaMKII). Practical considerations are made for developing an intracellular cross-correlation assay, including characterization of the fluorescent molecules involved, calibration procedures of the setup, and optimal measurement conditions. Potential pitfalls and artifacts are discussed, and the complex stoichiometry of the molecular system is accounted for by a new experimental and theoretical framework for TPCCS. Our tailored model accommodates up to 12 red-labeled CaMs binding to a single green-labeled dodecameric CaMKII holoenzyme and accounts for the probability distributions of bound ligand as well as the respective changes in fluorescence emission upon binding. The model was experimentally demonstrated both in solution and in living cells by analyzing the binding of Alexa 633(C2)CaM to eGFP-CaMKII under different biochemical conditions known to induce the basal, activated, and autophosphorylated forms of the enzyme. Key binding parameters, such as binding degree, concentrations of reactants, and binding affinities, were determined under varying conditions with certain assumptions. TPCCS thus offers the unique ability to test our biochemical understanding of protein dynamics in the intracellular milieu.


Figures

FIGURE 1
FIGURE 1
Optimization of measurement conditions. (A) Wavelength dependence of the fluorescence emission yield η for eGFP (circles) and Alexa 633 (squares). Data were measured in a standard two-photon FCS setup under optimal conditions with the pulse width of the laser set at 100 fs. The excitation power was adjusted to the respective fluorescence saturation limit for each fluorophore independently. (Bottom) Plot of fluorescence emission dependence on excitation power for eGFP (circle) and A633 (square) at 830 nm (B) and 920 nm (C). The fluorophores were independently analyzed in aqueous solution in a standard FCS setup. At low power levels (solid symbols) the slope is ∼2. The boxes (dashed line) mark the range of the respective possible excitation power for each individual fluorophore. Contrary to B where these areas show no overlap, C shows “safe” excitation powers where common excitation can be found.
FIGURE 2
FIGURE 2
Controlling photobleaching artifacts in two-photon cross-correlation spectroscopy experiments. To assess the optimal intensity where power-dependent bleaching and saturation artifacts were not introduced, cross-correlation and autocorrelation curves were measured for a high affinity binding reaction (10 mM Ca2+/1 mM MgATP) of eGFP-CaMKII (A) and A633(C2)CaM (B) at power densities between 0.5 and 3.5 MW/cm2. The data acquisition time for each curve was 60 s. Although the count rate per molecule that determines the quality of the measurement (A1, B1) increases with increasing excitation power, a decrease of the cross-correlation amplitude (C2) due to photobleaching is observed for excitation powers >1 MW/cm2, which can be easily mistaken for decreased binding (C1). The corresponding autocorrelation curves of the single species eGFP-CaMKII (A2) and A633(C2)CaM (B2) show an increase of the apparent particle number (A3, B3) and a decrease of apparent diffusion time (A4, B4), which indicate saturation and bleaching artifacts.
FIGURE 3
FIGURE 3
Characterizing labeling effects on CaM and CaMKII. The activity of CaMKII and eGFP-CaMKII was determined in the presence of increasing concentrations of wild-type CaM and A633(C2)CaM as described in Materials and Methods. CaM concentrations were varied from 3.13 nM to 3.2 μM. Activity is expressed as μmol/min/mg. Each data point represents a mean of three independent measurements (N = 3). The lines represent a fit of the experimental data to the hyperbolic form of the Michaelis-Menten equation (Eq. 30). The Kact and Vmax values were obtained for each protein combination by fitting the data using the Levenberg-Marquardt nonlinear least-squares fit (see Table 1 for values). No statistically significant differences were seen between CaMKII (solid squares, solid curve) and eGFP-CaMKII (shaded circles, shaded curve) when activated with wild-type CaM in terms of both Vmax and Kact. Although no difference in the Kact was apparent, A633(C2)CaM resulted in a statistically significant decrease in Vmax for both unlabeled CaMKII (solid triangles, dashed solid curve) and eGFP-CaMKII (shaded triangles, dashed shaded curve).
FIGURE 4
FIGURE 4
Monitoring complex binding stoichiometry of eGFP-CaMKII and A633(C2)CaM. Steady-state dual-color TPCCS measurements were obtained from the same reaction of A633(C2)CaM and eGFP-CaMKII in buffer solution under elevated Ca2+ (A), elevated Ca2+ and MgATP (B), and Ca2+-free (C) conditions. In the top panels, autocorrelation curves of the higher concentration of ligand, A633CaM (red), and respective cross-correlation curves (black) are shown; in the middle panel the corresponding autocorrelation curves of eGFP-CaMKII are plotted. The bottom panels show the binding distribution for each case, the average degree of binding Θ, and the dissociation constant Kd derived from the amplitudes of the measured correlation curves above assuming high affinity binding (Kd < 200 nM, see text) for Case (B). *Assumption based on literature value Kd <0.02 nM (Meyer et al., 1992).
FIGURE 5
FIGURE 5
Binding of A633(C2)CaM and eGFP-CaM-kinase II under varying conditions in living cells in culture. (Top) Confocal images of stably transfected eGFP-CaM-kinase II HEK293 cells electroporated with A633(C2)CaM are shown under 10 mM Ca2+ (left) followed by 10 mM Ca2+/1 mM MgATP (middle) and 200 mM EGTA (right) in the presence of 15 mg/ml α-hemolysin in the same dish (scale bar = 10 μm). (Middle) Intracellular auto- and cross-correlation curves were measured simultaneously under each of the conditions but at lower intracellular protein concentrations than used for the LSM images above. Plotted are the six subsequent 10-s acquisitions (thin lines) for both the auto- and cross-correlation measurements and their respective average curves with data fits (corresponding thick lines). (Note that the y axis for the green autocorrelation in A, right side in green, has a different scale than the other curves.) The amplitude of the cross-correlation curve (black) increases under elevated Ca2+ conditions (A, B) and almost disappears in the absence of Ca2+ (C). In comparison to the in vitro case, the cross-correlation amplitudes for both elevated Ca2+ conditions (A, B) are reduced due to the additional presence of unlabeled endogenous CaM in the cell. Distribution plots are shown at the bottom as seen in Fig. 4. The hatched shaded bars represent the distribution of CaM irrespective of the label, and the red bars denote the distribution of Alexa 633-labeled CaM molecules only. In A and B, an assumption of a high binding affinity yields virtually full binding (hatched shaded bar) and the indicated values for the labeled fractions r. In C the hatched bars exemplify a CaM distribution for r = 0.3 based on A and B. Distributions for conditions with other r fractions are also denoted (shaded lines).

References

    1. Abbotto, A., A. Beverina, R. Bozio, A. Facchetti, C. Ferrante, G. A. Pagani, D. Pedron, and R. Signorini. 2002. Novel heterocycle-based two-photon absorbing dyes. Org. Lett. 4:1495–1498. - PubMed
    1. Asimov, M. M., V. N. Gavrilenko, and A. N. Rubinov. 1990. Laser photolysis of laser dyes and the influence of triplet quenchers. J. Luminesc. 46:243–249.
    1. Babu, Y. S., J. S. Sack, T. J. Greenhough, C. E. Bugg, A. R. Means, and W. J. Cook. 1985. Three-dimensional structure of calmodulin. Nature. 315:37–40. - PubMed
    1. Bacia, K., I. V. Majoul, and P. Schwille. 2002. Probing the endocytic pathway in live cells using dual-color fluorescence cross-correlation analysis. Biophys. J. 83:1184–1193. - PMC - PubMed
    1. Berland, K. M., and G. Shen. 2003. Excitation saturation in two-photon fluorescence correlation spectroscopy. Appl. Opt. 42:5566–5576. - PubMed

Publication types

MeSH terms

Substances