

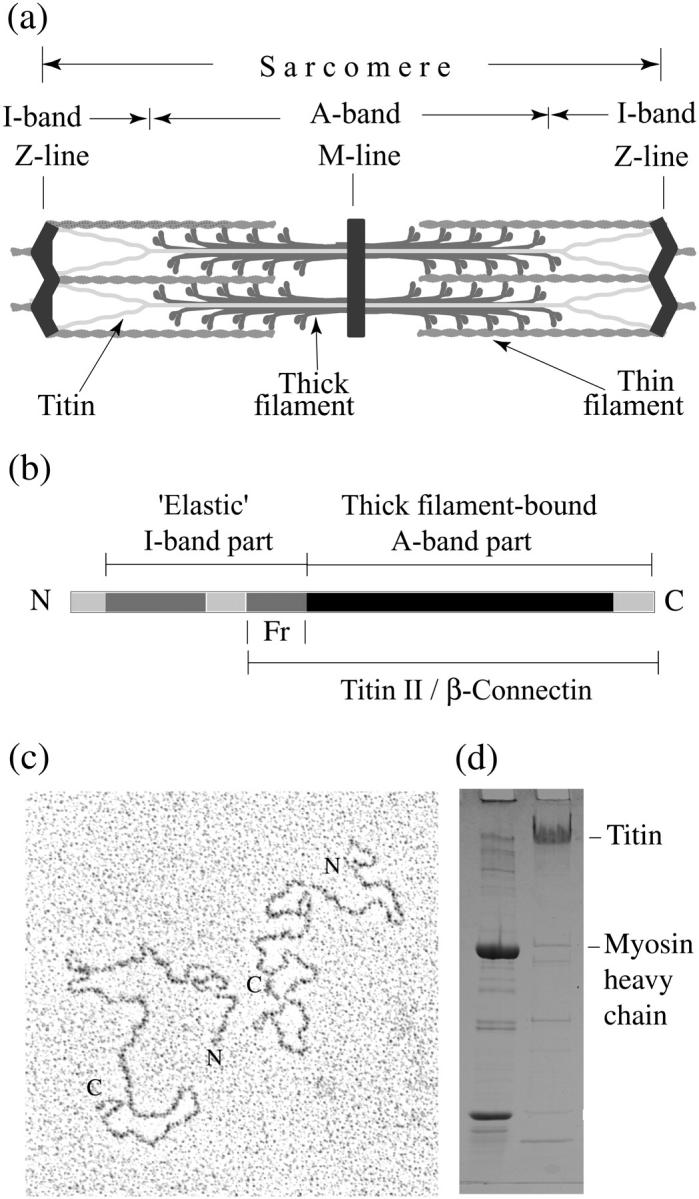
Persistence length of titin from rabbit skeletal muscles measured with scattering and microrheology techniques
- PMID: 15792980
- PMCID: PMC1305640
- DOI: 10.1529/biophysj.104.054908
Persistence length of titin from rabbit skeletal muscles measured with scattering and microrheology techniques
Abstract
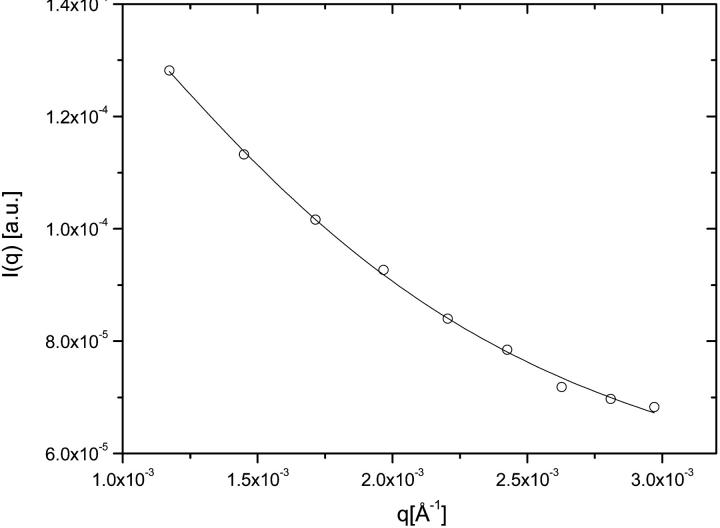
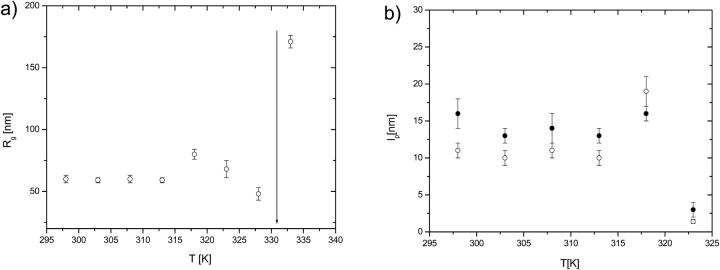
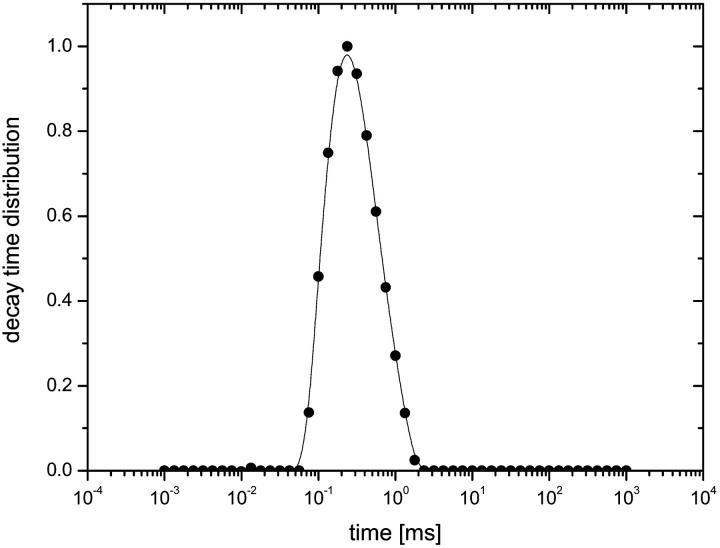
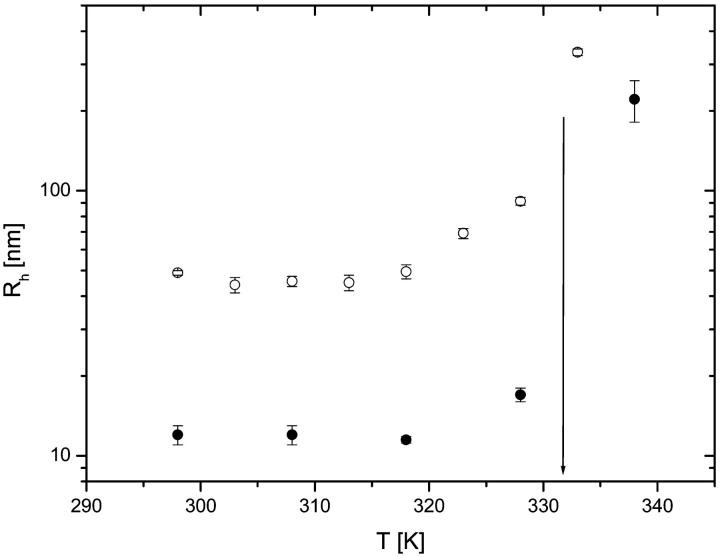
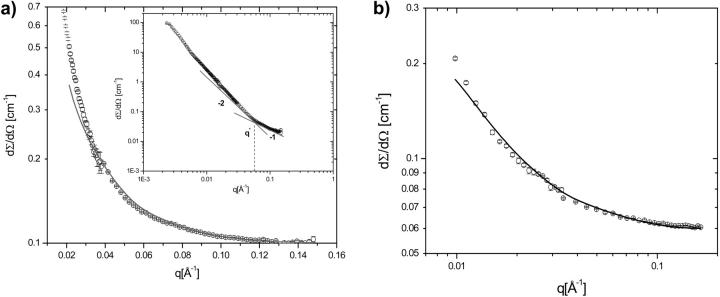
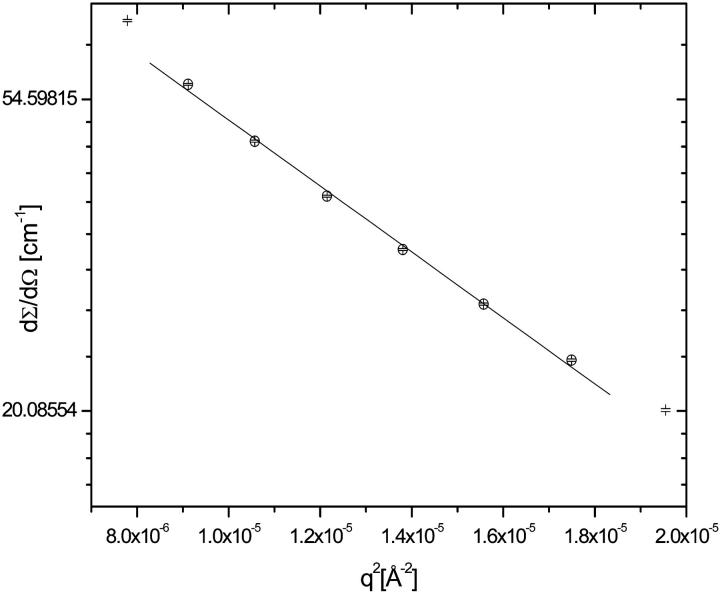
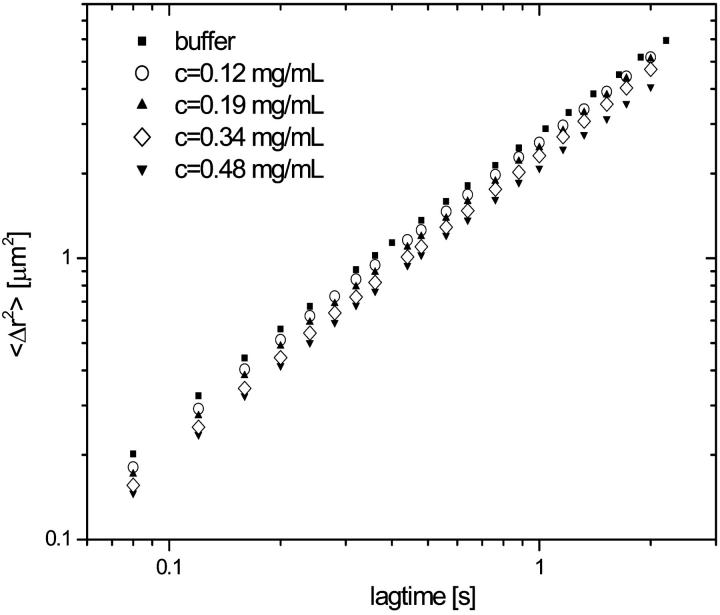
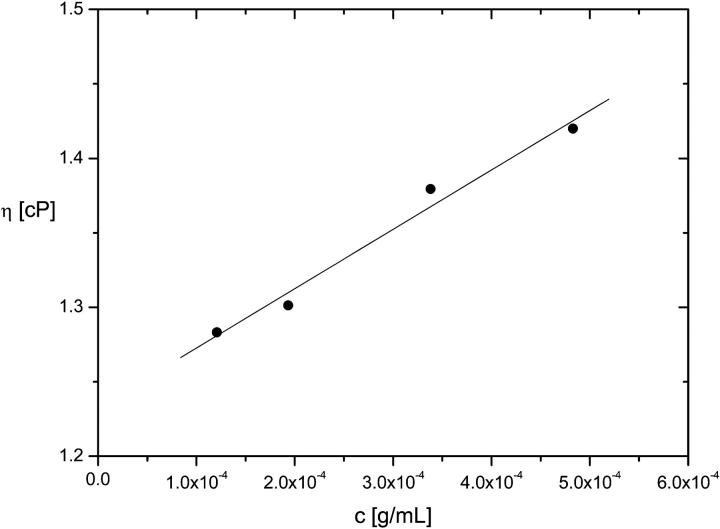
The persistence length of titin from rabbit skeletal muscles was measured using a combination of static and dynamic light scattering, and neutron small angle scattering. Values of persistence length in the range 9-16 nm were found for titin-II, which corresponds to mainly physiologically inelastic A-band part of the protein, and for a proteolytic fragment with 100-nm contour length from the physiologically elastic I-band part. The ratio of the hydrodynamic radius to the static radius of gyration indicates that the proteins obey Gaussian statistics typical of a flexible polymer in a -solvent. Furthermore, measurements of the flexibility as a function of temperature demonstrate that titin-II and the I-band titin fragment experience a similar denaturation process; unfolding begins at 318 K and proceeds in two stages: an initial gradual 50% change in persistence length is followed by a sharp unwinding transition at 338 K. Complementary microrheology (video particle tracking) measurements indicate that the viscoelasticity in dilute solution behaves according to the Flory/Fox model, providing a value of the radius of gyration for titin-II (63 +/- 1 nm) in agreement with static light scattering and small angle neutron scattering results.
Figures
References
-
- Amodeo, P., F. Fraterneli, A. M. Lesk, and A. Pastore. 2001. Modularity and homology: modelling of the titin type I modules and their interfaces. J. Mol. Biol. 311:283–296. - PubMed
-
- Berne, B. J., and R. Pecora. 2000. Dynamic Light Scattering. Dover Publications, New York, NY.
-
- Bray, D. 1992. Cell Movements. Garland, New York, NY.
-
- Burchard, W. 1999. Solution properties of branched macromolecules. Adv. Polym. Sci. 143:113–194.
-
- Cifra, P., and T. Bleha. 1999. Anisotropy in the dimensional and elastic parameters of confined macromolecules. Macomol. Theory Simul. 8:603–610.
MeSH terms
Substances
LinkOut - more resources
Full Text Sources
Other Literature Sources
