. 2005 Jun;88(6):4411-20.
doi: 10.1529/biophysj.104.053736. Epub 2005 Mar 25.

Correlation between vesicle quantal size and fusion pore release in chromaffin cell exocytosis

Affiliations

Correlation between vesicle quantal size and fusion pore release in chromaffin cell exocytosis

Christian Amatore et al. Biophys J. 2005 Jun.

Abstract

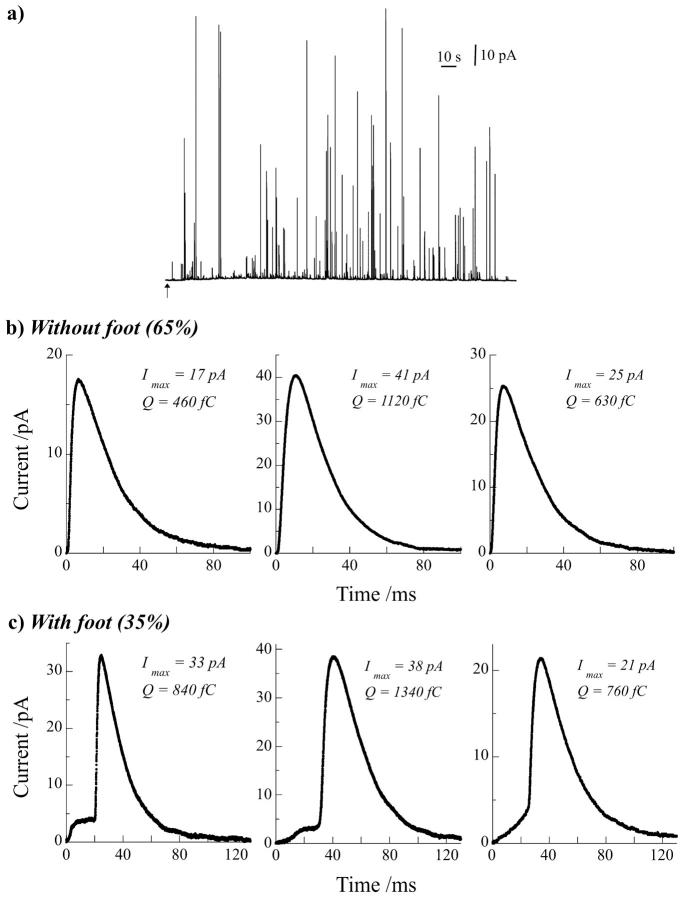
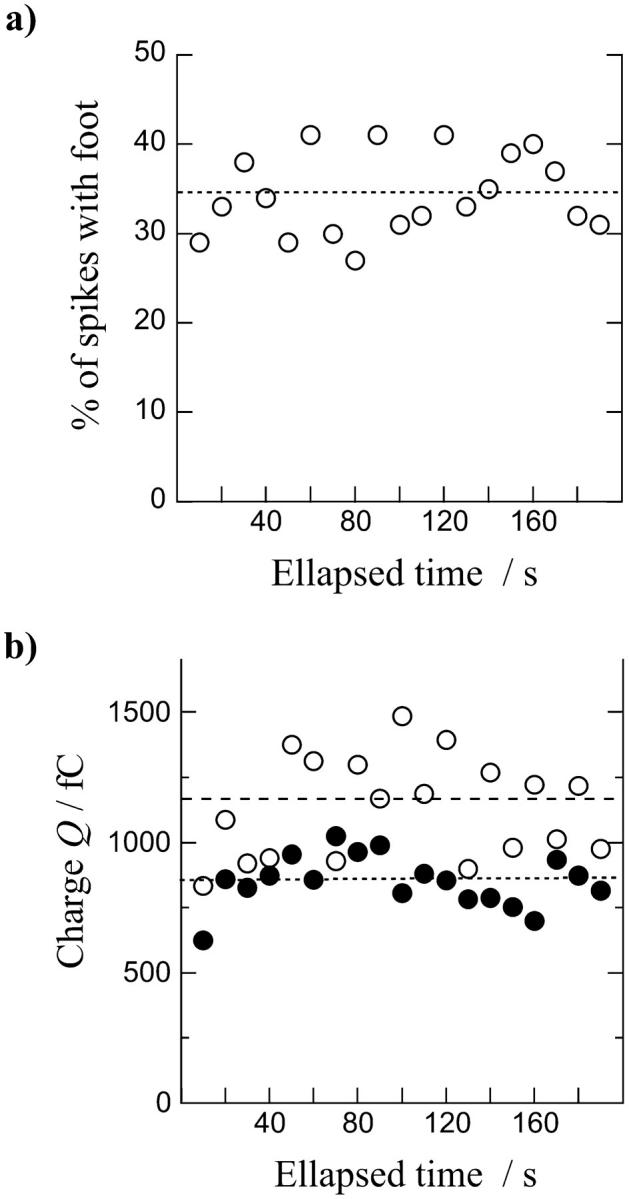
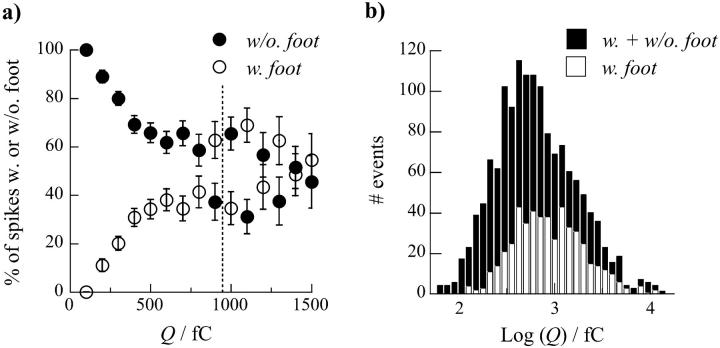
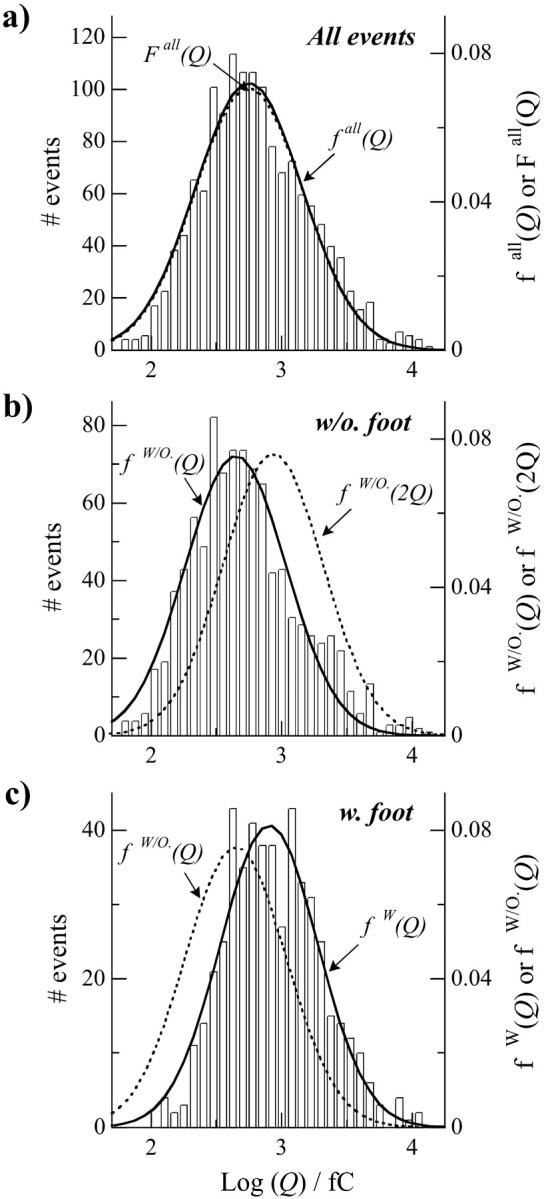
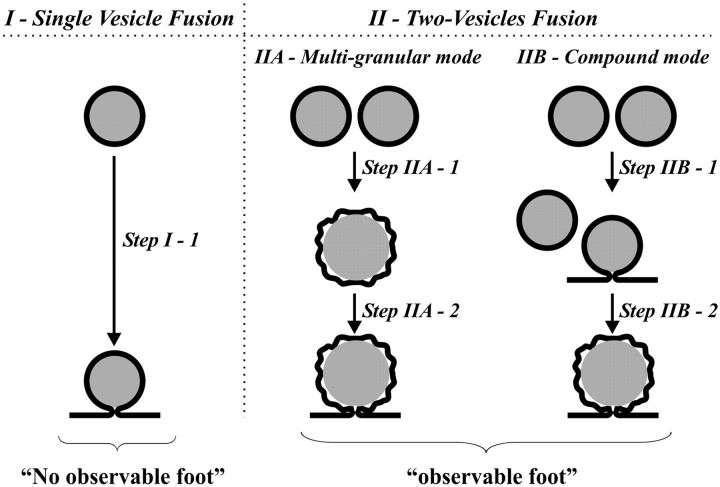
A significant number of exocytosis events recorded with amperometry demonstrate a prespike feature termed a "foot" and this foot has been correlated with messengers released via a transitory fusion pore before full exocytosis. We have compared amperometric spikes with a foot with spikes without a foot at chromaffin cells and found that the probability of detecting a distinct foot event is correlated to the amount of catecholamine released. The mean charge of the spikes with a foot was found to be twice that of the spikes without a foot, and the frequency of spikes displaying a foot was zero for small spikes increasing to approximately 50% for large spikes. It is hypothesized that in chromaffin cells, where the dense core is believed to nearly fill the vesicle, the expanding core is a controlling factor in opening the fusion pore, that prefusion of two smaller vesicles leads to excess membrane, and that this slows pore expansion leading to an increased observation of events with a foot. Clearly, the physicochemical properties of vesicles are key factors in the control of the dynamics of release through the fusion pore and the high and variable frequency of this release makes it highly significant.


Figures

FIGURE 1
FIGURE 1
(a) Representative exocytotic response of a bovine chromaffin cell detected by amperometry at a carbon fiber microelectrode. The arrow under the trace represents the start of injection (10 s) on the cell of the stimulus solution containing Ba2+ (2 mM). From these traces three representative amperometric events were extracted without (b) and with a discernable foot (c) preceding the spike. Three different shapes of foot were usually observed (c) that differ on how the foot current onsets (fast versus progressive rise, see left and middle spikes, respectively) and if the foot current linearly increases with time until the spike onset (right spike) or stabilizes as a plateau current after its initial rising phase until the current burst (middle spike). Quantitative parameters of each spike are given.
FIGURE 2
FIGURE 2
(a) Evolution of the percentage of spikes with a foot observed on amperometric traces as a function of time after the chromaffin cell response to stimulation (10-s injection of a 2 mM Ba2+ solution). (b) Compared evolution of the electrical charge Q of spikes with (○) or without (•) a foot along the experiment. Foot percentage and means of Q values were calculated every 10-s period. The mean of each parameter for all pooled values as given in Table 1 is represented on each graph (small dotted line for spikes without foot and large dotted line for spikes with foot), showing the variations of the values sampled over a small time window (10 s) across the global average.
FIGURE 3
FIGURE 3
(a) Evolution of the percentage of spikes with (○) or without (•) a foot as a function of their total electrical charge Q (bin = 100 fC). Error bars have been calculated as mean ± SE based on the probability p in a binomial law to observe a foot or not: σ2 = p(1 − p); SE = σ/(nvalues)1/2. Values above 1500 fC are not shown because of too large fluctuations in the percentages of spikes due to a small number of events occurring in this range of Q. The vertical dotted line is the mean charge considering all spikes (see Table 1). (b) Histograms of the Q value distribution for all spikes (black bar) and only for spikes with a foot (open bar). Log transformed values were used since histograms of raw values are heavily skewed to the right. The two histograms are superimposed so that one can visually see the contribution for spikes without a foot from the difference between the envelope of the distribution for all spikes and the one for spikes with a foot.
FIGURE 4
FIGURE 4
Histograms of the log (Q) values for all spikes (a), and separately for the ones without a foot (b) and the ones with a foot (c). Each distribution is presented as a function of events number (left y axis) or the statistical probability density (right y axis) and is fitted by a single Gaussian distribution, named fall(Q) for all spikes, fW/O(Q) for spikes without a foot, and fW/O(Q) for spikes with a foot. The parameters for the Gaussian distributions are 2.75 ± 0.02 and 0.82 ± 0.02 for all spikes, 2.65 ± 0.02 and 0.77 ± 0.02 for spikes without a foot, and 2.91 ± 0.02 and 0.75 ± 0.02 for spikes with a foot for their center position (log (Q)max) and their half-width, σ, respectively. Graphs are presented in a column so that one can easily observe the shift between centers of the different distributions. The comparison between the Gaussian fitting fW/O(Q) and the distribution for spikes with a foot in c shows the differences of vesicular quantal size between spikes with and without a foot. In b, a mathematically constructed Gaussian distribution fW/O(2Q) was created using the same conditions but applied to a mean charge of 2Q instead of Q (parameters: log (Q)max = 2.95; σ = 0.77). fW/O(2Q) and fW(Q) coincide well within the accuracy of their determination, showing that vesicles leading to the events with a foot contain on average twice the quantity of catecholamines of the vesicles that lead to events without foot. Finally, we constructed a Gaussian distribution Fall(Q) corresponding to all spikes by the combination of the two individual distributions fW/O(Q) and fW/O(2Q), weighted each as a function in the overall of the percentage of spikes without and with foot, respectively, 65% and 35%. Fall(Q) is compared in a with the distribution of log (Q) values.
FIGURE 5
FIGURE 5
Cartoon depicting the different possibilities considered here for vesicle fusion and exocytosis in relevance with the presence of an observable foot. See text for the definition of each mode.

References

    1. Albillos, A., G. Dernick, H. Horstmann, W. Almers, G. A. deToledo, and M. Lindau. 1997. The exocytotic event in chromaffin cells revealed by patch amperometry. Nature. 389:509–512. - PubMed
    1. Almers, W. 2001. Fusion needs more than SNAREs. Nature. 409:567–568. - PubMed
    1. Amatore, C., Y. Bouret, and L. Midrier. 1999. Time-resolved dynamics of the vesicle membrane during individual exocytotic secretion events, as extracted from amperometric monitoring of adrenaline exocytosis from chromaffin cells. Biochimie. 5:2151–2162.
    1. Amatore, C., Y. Bouret, E. R. Travis, and R. M. Wightman. 2000a. Adrenaline release by chromaffin cells: Constrained swelling of the vesicle matrix leads to full fusion. Angew. Chem. Int. Ed. 39:1952–1955. - PubMed
    1. Amatore, C., Y. Bouret, E. R. Travis, and R. M. Wightman. 2000b. Interplay between membrane dynamics, diffusion and swelling pressure governs individual vesicular exocytotic events during release of adrenaline by chromaffin cells. Biochimie. 82:481–496. - PubMed

Publication types

LinkOut - more resources