Comparative Study
. 2005 Apr 4;201(7):1157-67.
doi: 10.1084/jem.20041930. Epub 2005 Mar 28.

Type I interferon dependence of plasmacytoid dendritic cell activation and migration

Affiliations
Comparative Study

Type I interferon dependence of plasmacytoid dendritic cell activation and migration

Carine Asselin-Paturel et al. J Exp Med. .

Abstract

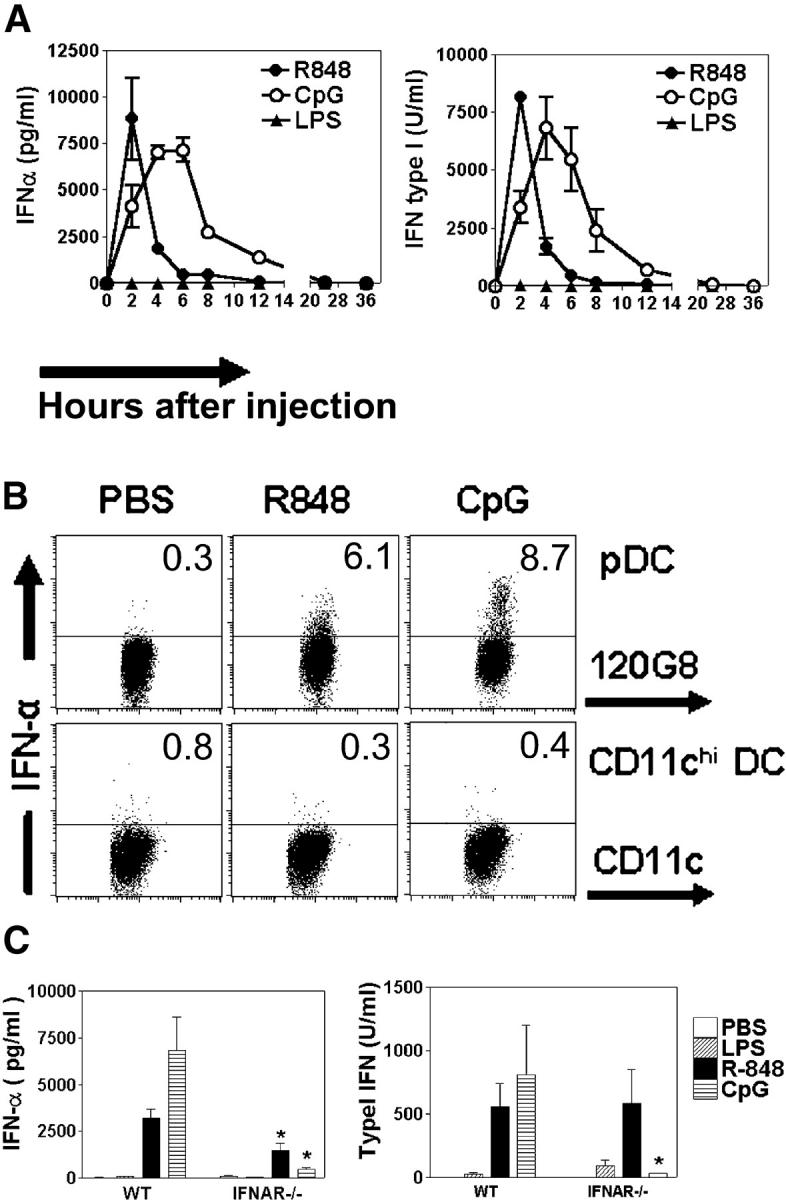
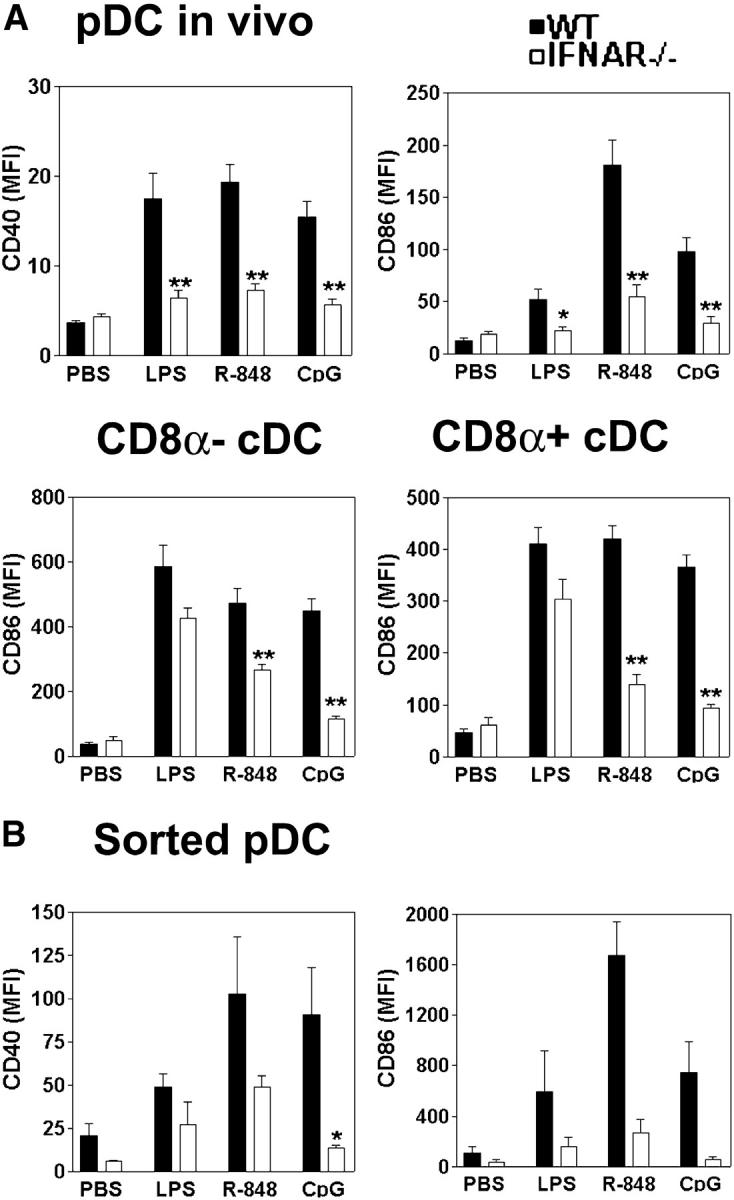
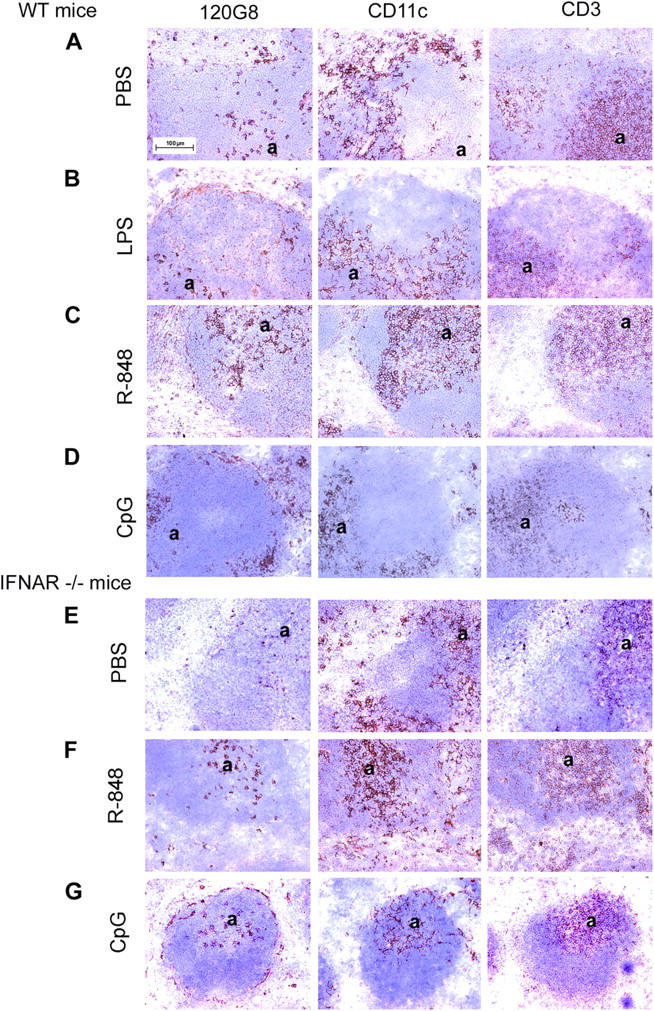
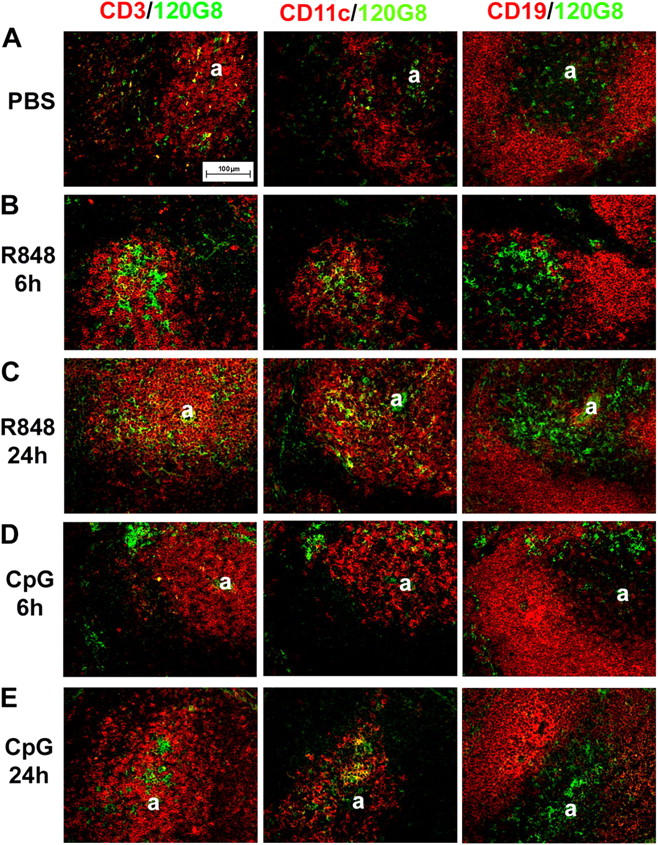
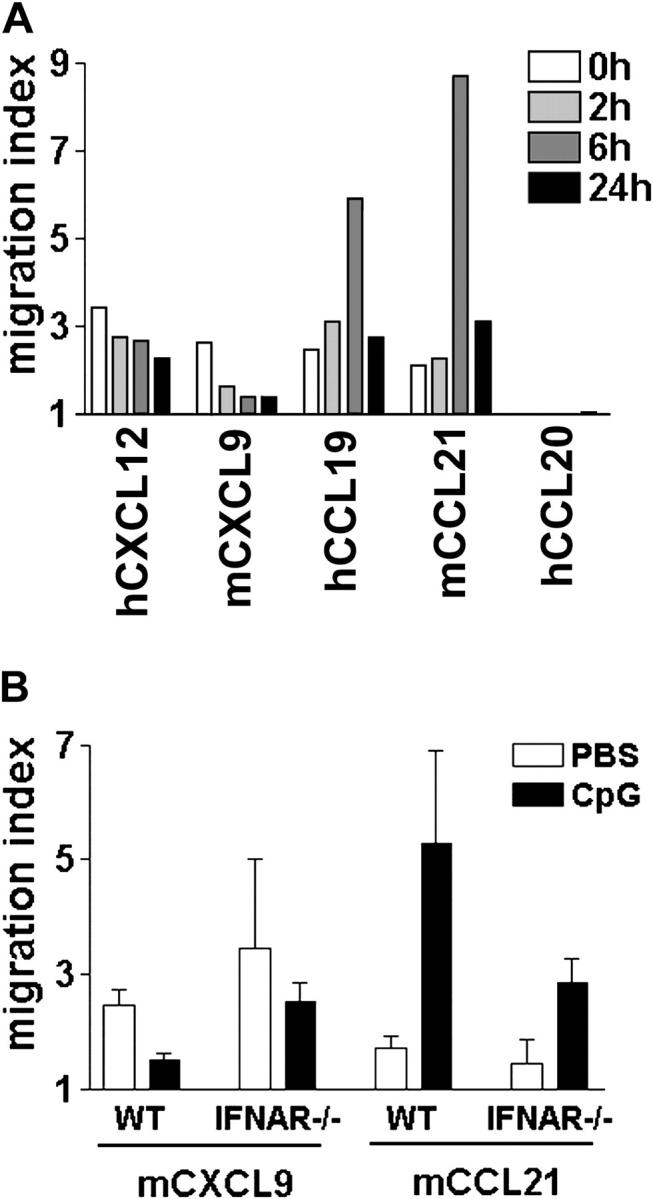
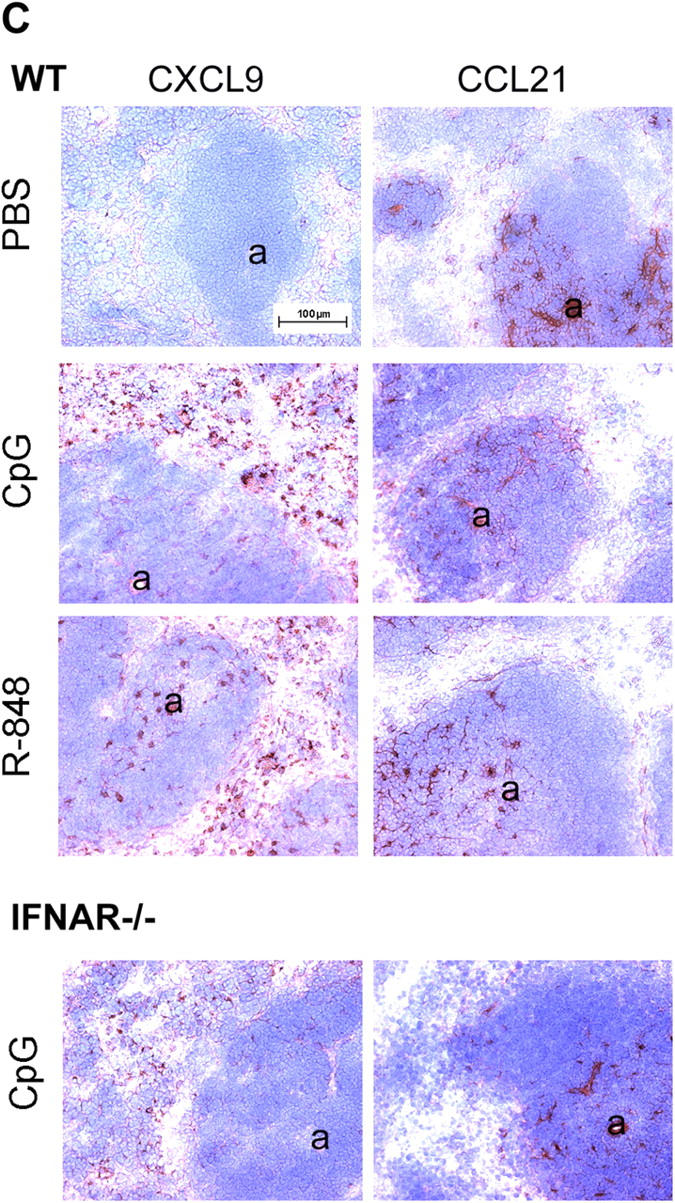
Differential expression of Toll-like receptor (TLR) by conventional dendritic cells (cDCs) and plasmacytoid DC (pDCs) has been suggested to influence the type of immune response induced by microbial pathogens. In this study we show that, in vivo, cDCs and pDCs are equally activated by TLR4, -7, and -9 ligands. Type I interferon (IFN) was important for pDC activation in vivo in response to all three TLR ligands, whereas cDCs required type I IFN signaling only for TLR9- and partially for TLR7-mediated activation. Although TLR ligands induced in situ migration of spleen cDC into the T cell area, spleen pDCs formed clusters in the marginal zone and in the outer T cell area 6 h after injection of TLR9 and TLR7 ligands, respectively. In vivo treatment with TLR9 ligands decreased pDC ability to migrate ex vivo in response to IFN-induced CXCR3 ligands and increased their response to CCR7 ligands. Unlike cDCs, the migration pattern of pDCs required type I IFN for induction of CXCR3 ligands and responsiveness to CCR7 ligands. These data demonstrate that mouse pDCs differ from cDCs in the in vivo response to TLR ligands, in terms of pattern and type I IFN requirement for activation and migration.


Figures

Figure 1.
Figure 1.
In vivo production of type I IFN in response to TLR ligands. (A) Sera from 129Sv WT mice were collected at different time point after LPS, resiquimod (R-848), or CpG-ODN treatment and titrated for IFN-α by ELISA and type I IFN by biological assay. The sera of mice injected with DOTAP alone were negative for IFN-α and type I IFN. Mean cytokine concentration (± SEM) of three mice per group is shown (two independent experiments giving similar results). (B) Spleen cells from 129Sv WT mice were collected 3 h after PBS or CpG-ODN injection, or 1 h after resiquimod injection and stained, as described in Materials and methods. pDC were gated as 120G8+CD11clow cells. CD11chigh DC were gated as 120G8CD11chigh cells. Dot plots shown for each staining are representative of at least three determinations in two separate experiments. (C) Sera from 129Sv WT mice or IFNAR−/− mice were collected 2 h after PBS, LPS, or resiquimod treatment and 6 h after CpG-ODN treatment and titrated for IFN-α by ELISA and IFN type I by biological assay. Mean cytokine concentration (± SEM) of 6–16 mice per group is shown (two to five independent experiments giving similar results). *, P < 0.01, compared with WT mice.
Figure 2.
Figure 2.
Mouse DC subset activation in response to TLR ligands. (A) Spleen cells from 129Sv WT mice or IFNAR−/− mice, treated with PBS, LPS, resiquimod (R-848), or CpG-ODN, were collected 6 h after treatment and stained as described in Materials and methods. CD40 (left panels) and CD86 (right panels) expression on 120G8+CD11clo pDC (upper panels), only CD86 on CD8 cDC (lower right panel), and CD8+ cDC (lower left panel) were analyzed. Mean fluorescence intensity (MFI) ± SEM of six mice per group (two independent experiments giving similar results) is shown. (B) Sorted 120G8+CD11clow pDC were isolated from 129Sv WT mice or IFNAR−/− mice and stimulated with medium, LPS, resiquimod, or CpG-ODN as described in Materials and methods. MFI ± SEM of CD40 (left panels) and CD86 (right panels) expression is shown for three independent experiments. *, P < 0.05; **, P < 0.01, compared with WT mice.
Figure 3.
Figure 3.
Spleen dendritic cells localization after TLR treatment. (A–D) Spleens from 129Sv WT mice were collected 6 h after treatment with (A) PBS, (B) LPS, (C) resiquimod (R-848), or (D) CpG-ODN. (E–G) Spleens from IFNAR−/− mice were collected 6 h after treatment with (E) PBS, (F) resiquimod, or (G) CpG-ODN. Spleen serial sections were obtained and stained with 120G8 (pDC, left panels), anti-CD11c (cDC, middle panels) or anti-CD3ɛ (T cells, right panels) Abs as described in Materials and methods. One representative staining out of three mice per group is shown (two independent stainings). a, arteriol.
Figure 4.
Figure 4.
Kinetics of spleen pDC in situ migration after resiquimod (R-848) or CpG-ODN treatment. Spleen from 129Sv mice were collected at 6 h or 24 h after (A) PBS, (B, C) R-848, or (D, E) CpG-ODN treatment, as described in Materials and methods. Spleen serial sections were obtained and costained with 120G8 in green and in red: anti-CD3ɛ (left panels), anti-CD11c (middle panels), or anti-CD19 (right panels) Abs, as described in Materials and methods. Overlaid pictures of the two fluorescences on identical sections are shown, for one representative mouse of three per group. a, arteriol.
Figure 5.
Figure 5.
Role of CCL21 and CXCL9 chemokines in migration of CpG-activated mouse pDC in the spleen. (A) Spleens from 129Sv mice were isolated 0 h, 2 h, 6 h, and 24 h after CpG-ODN in vivo treatment. Response of activated spleen pDC to various chemokines was studied in Transwell (Corning, Inc.) migration assay. Results are expressed as a migration index (number of migrating cells in chemokine/number of migrating cells in medium). One representative experiment three is shown. (B) Spleens from 129Sv WT and IFNAR−/− mice were isolated 6 h after PBS or CpG-ODN in vivo treatment. Response of activated spleen pDC to CXCL9 and CCL21 was studied in Transwell migration assay. Mean migration index from at least three independent experiments is shown. (C) Spleens from 129Sv WT and IFNAR−/− mice were collected 6 h after treatment with PBS, CpG-ODN, or resiquimod. Spleen sections were obtained and stained with anti-CXCL9 (left panels) or -CCL21 (right panels) Abs as described in Materials and methods. One representative staining out of three mice per group is shown. a, arteriol.
Figure 5.
Figure 5.
Role of CCL21 and CXCL9 chemokines in migration of CpG-activated mouse pDC in the spleen. (A) Spleens from 129Sv mice were isolated 0 h, 2 h, 6 h, and 24 h after CpG-ODN in vivo treatment. Response of activated spleen pDC to various chemokines was studied in Transwell (Corning, Inc.) migration assay. Results are expressed as a migration index (number of migrating cells in chemokine/number of migrating cells in medium). One representative experiment three is shown. (B) Spleens from 129Sv WT and IFNAR−/− mice were isolated 6 h after PBS or CpG-ODN in vivo treatment. Response of activated spleen pDC to CXCL9 and CCL21 was studied in Transwell migration assay. Mean migration index from at least three independent experiments is shown. (C) Spleens from 129Sv WT and IFNAR−/− mice were collected 6 h after treatment with PBS, CpG-ODN, or resiquimod. Spleen sections were obtained and stained with anti-CXCL9 (left panels) or -CCL21 (right panels) Abs as described in Materials and methods. One representative staining out of three mice per group is shown. a, arteriol.
Figure 6.
Figure 6.
Dendritic cells localization in mouse spleens after MCMV infection. Spleens from 129Sv WT mice were collected 1.5 d after viral infection with MCMV. Spleen sections were stained with (A) 120G8 (pDC) or (B) anti-CD11c (cDC) Abs as described in Materials and methods. (C) Spleen sections were costained with 120G8 in green and anti-IFNα mAb in red, as described in Materials and methods. Overlaid pictures of the two fluorescences on identical sections are shown, for one representative staining out of three mice per group. a, arteriol.

References

    1. Banchereau, J., and R.M. Steinman. 1998. Dendritic cells and the control of immunity. Nature. 392:245–252. - PubMed
    1. Medzhitov, R. 2001. Toll-like receptors and innate immunity. Nat. Rev. Immunol. 1:135–145. - PubMed
    1. Forster, R., A. Schubel, D. Breitfeld, E. Kremmer, I. Renner-Muller, E. Wolf, and M. Lipp. 1999. CCR7 coordinates the primary immune response by establishing functional microenvironments in secondary lymphoid organs. Cell. 99:23–33. - PubMed
    1. Sallusto, F., and A. Lanzavecchia. 2000. Understanding dendritic cell and T-lymphocyte traffic through the analysis of chemokine receptor expression. Immunol. Rev. 177:134–140. - PubMed
    1. Shortman, K., and Y.J. Liu. 2002. Mouse and human dendritic cell subtypes. Nat. Rev. Immunol. 2:151–161. - PubMed

Publication types

MeSH terms