. 2005 Apr;125(4):413-26.
doi: 10.1085/jgp.200409242. Epub 2005 Mar 14.

Mechanism of the voltage sensitivity of IRK1 inward-rectifier K+ channel block by the polyamine spermine

Affiliations

Mechanism of the voltage sensitivity of IRK1 inward-rectifier K+ channel block by the polyamine spermine

Hyeon-Gyu Shin et al. J Gen Physiol. 2005 Apr.

Abstract

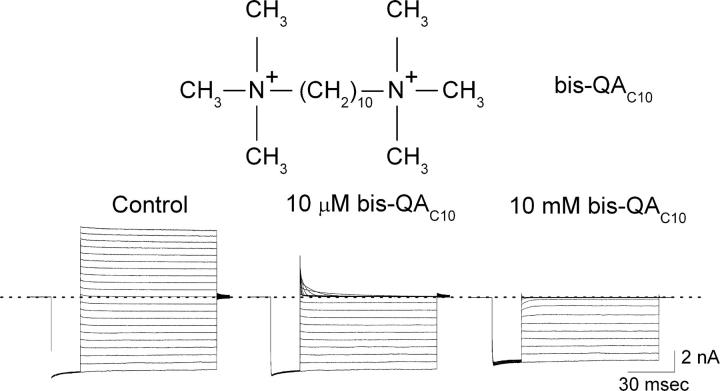
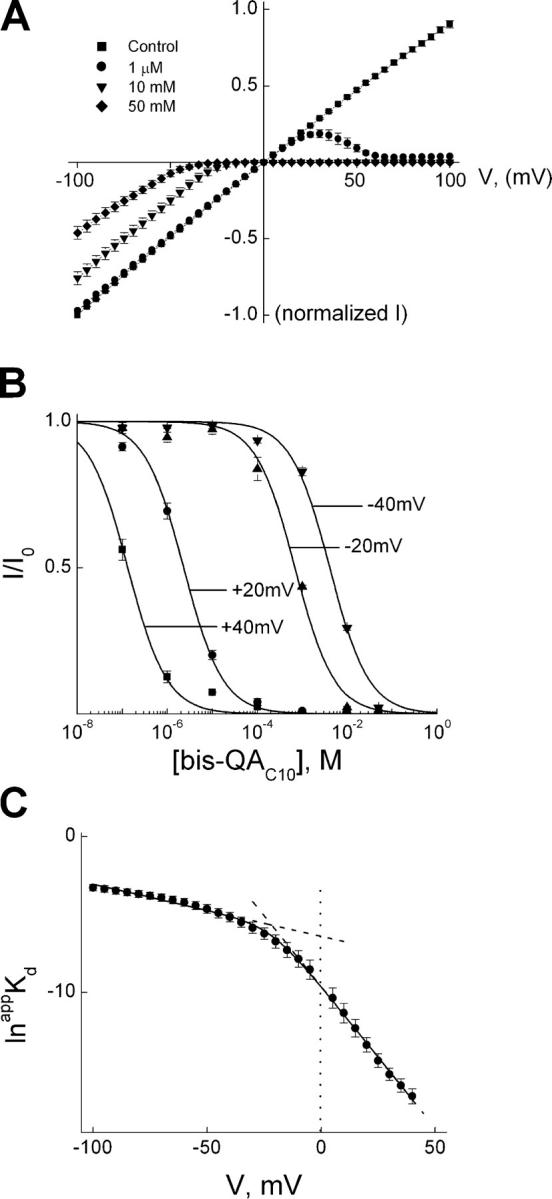
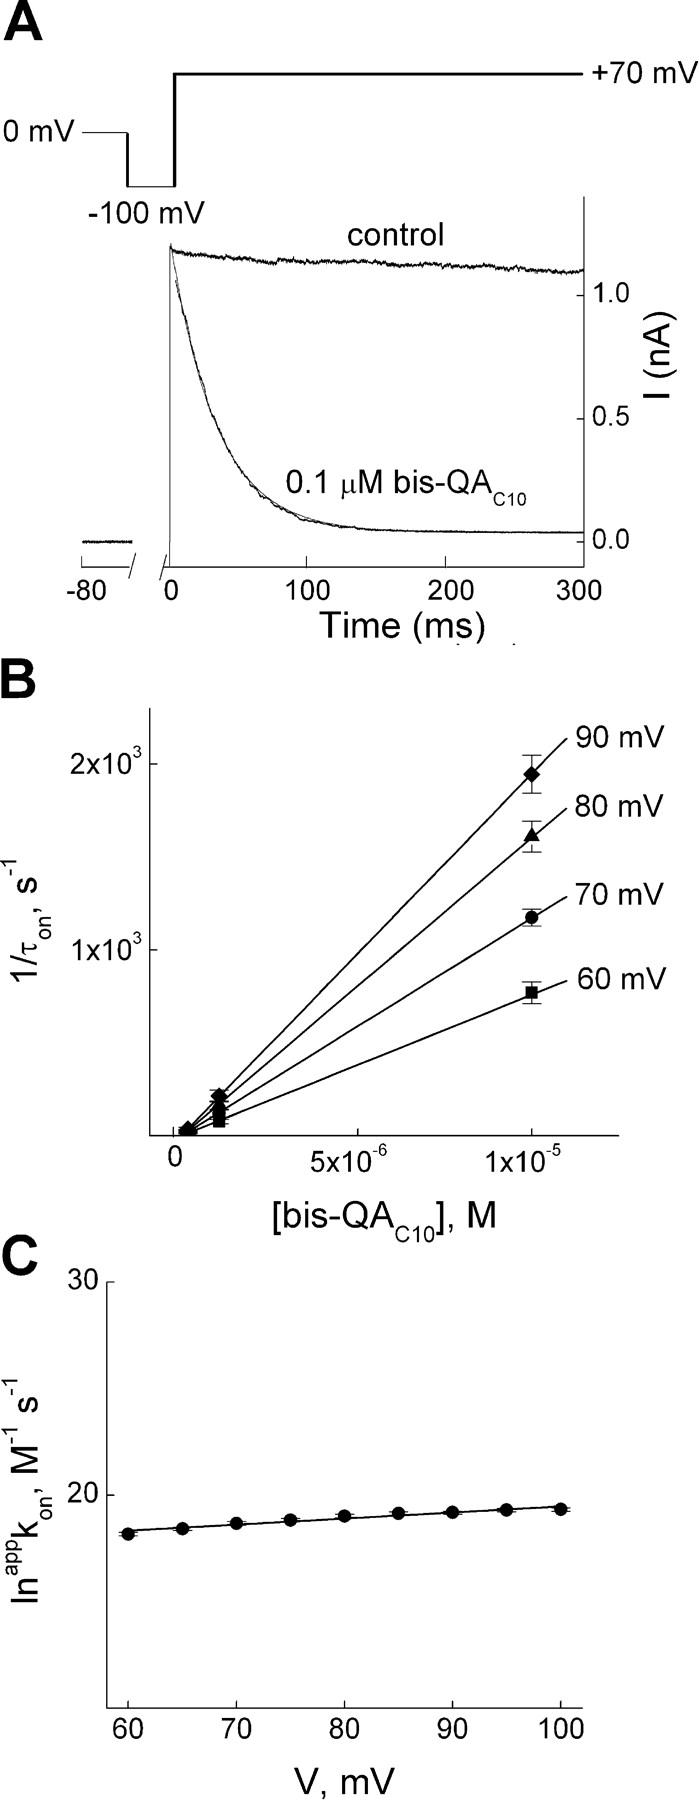
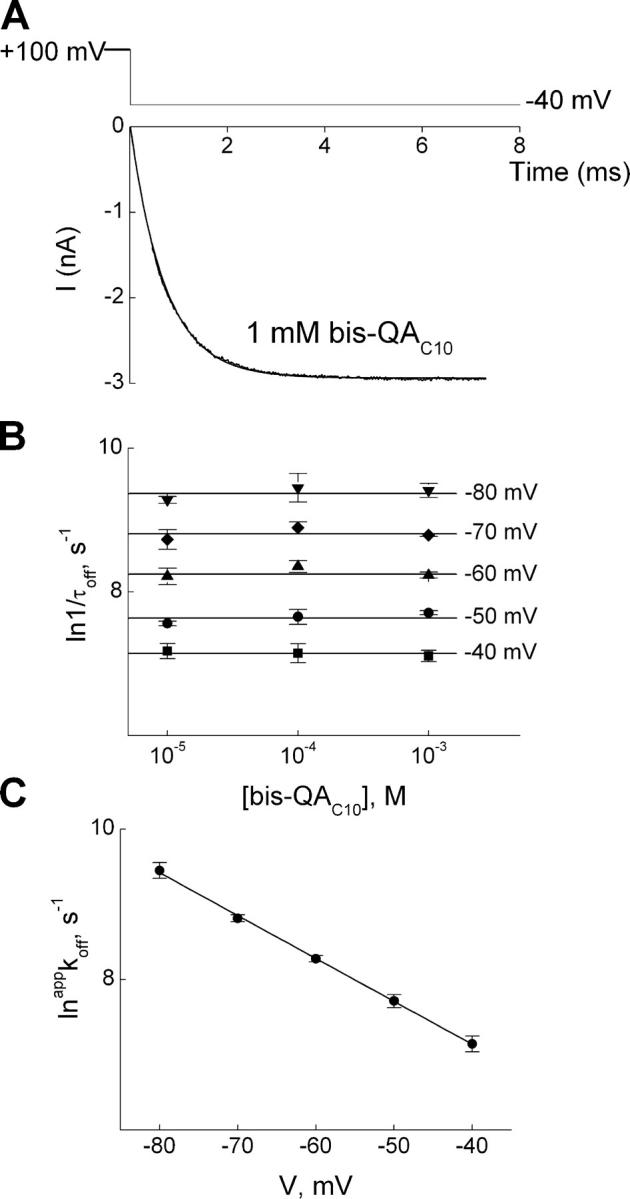
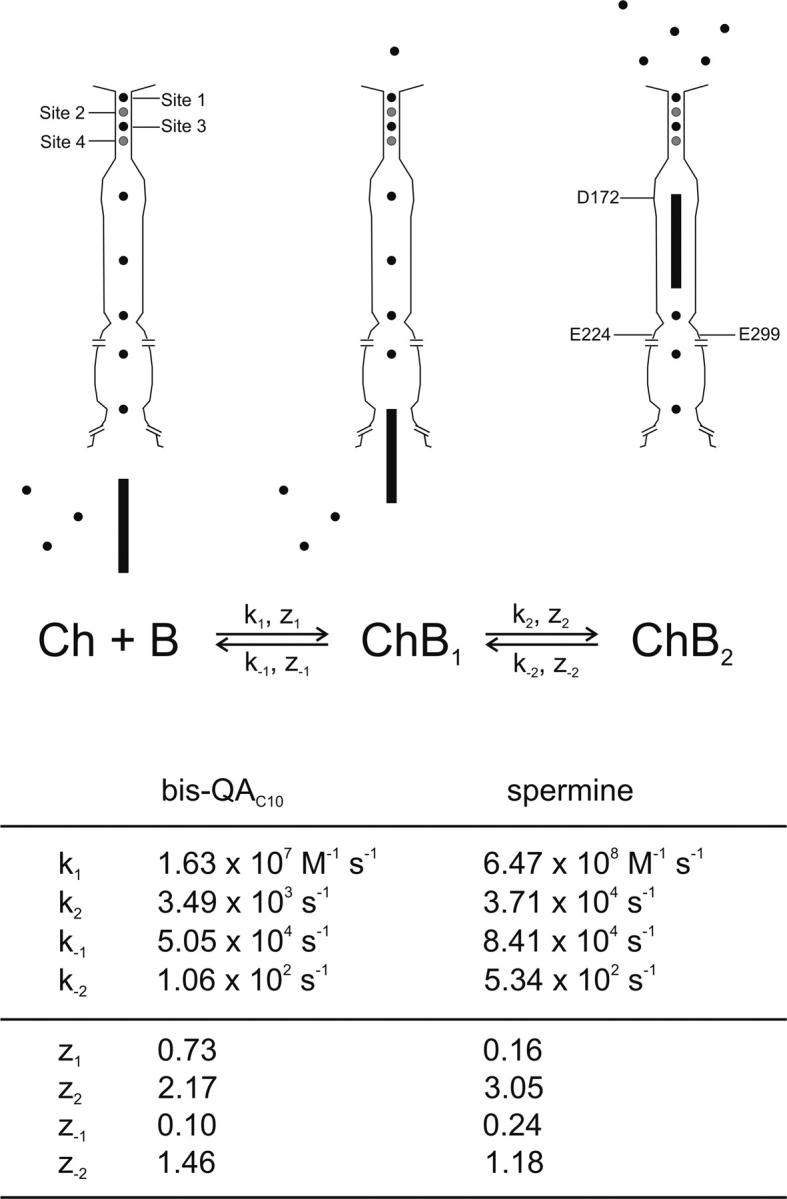
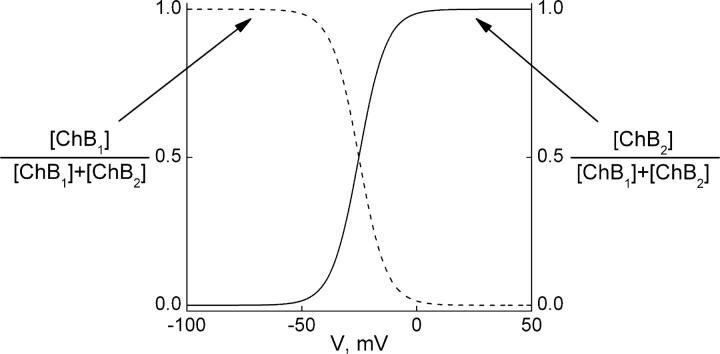
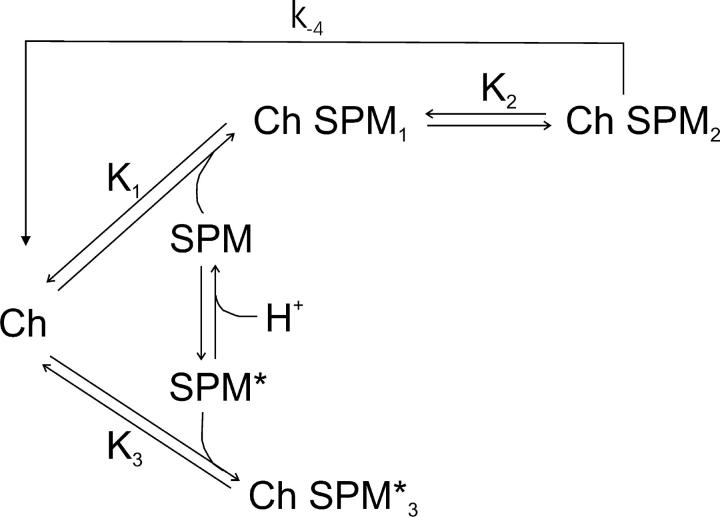
IRK1 (Kir2.1) inward-rectifier K+ channels exhibit exceedingly steep rectification, which reflects strong voltage dependence of channel block by intracellular cations such as the polyamine spermine. On the basis of studies of IRK1 block by various amine blockers, it was proposed that the observed voltage dependence (valence approximately 5) of IRK1 block by spermine results primarily from K+ ions, not spermine itself, traversing the transmembrane electrical field that drops mostly across the narrow ion selectivity filter, as spermine and K+ ions displace one another during channel block and unblock. If indeed spermine itself only rarely penetrates deep into the ion selectivity filter, then a long blocker with head groups much wider than the selectivity filter should exhibit comparably strong voltage dependence. We confirm here that channel block by two molecules of comparable length, decane-bis-trimethylammonium (bis-QA(C10)) and spermine, exhibit practically identical overall voltage dependence even though the head groups of the former are much wider ( approximately 6 A) than the ion selectivity filter ( approximately 3 A). For both blockers, the overall equilibrium dissociation constant differs from the ratio of apparent rate constants of channel unblock and block. Also, although steady-state IRK1 block by both cations is strongly voltage dependent, their apparent channel-blocking rate constant exhibits minimal voltage dependence, which suggests that the pore becomes blocked as soon as the blocker encounters the innermost K+ ion. These findings strongly suggest the existence of at least two (potentially identifiable) sequentially related blocked states with increasing numbers of K+ ions displaced. Consequently, the steady-state voltage dependence of IRK1 block by spermine or bis-QA(C10) should increase with membrane depolarization, a prediction indeed observed. Further kinetic analysis identifies two blocked states, and shows that most of the observed steady-state voltage dependence is associated with the transition between blocked states, consistent with the view that the mutual displacement of blocker and K+ ions must occur mainly as the blocker travels along the long inner pore.


Figures

F<sc>igure</sc> 1.
Figure 1.
Inhibition of IRK1 currents by bis-QAC10. Chemical structure of bis-QAC10 is shown on top. Current traces were recorded from a single patch in the absence (control) or presence of bis-QAC10 at the concentrations indicated. Currents were elicited by stepping membrane voltage from the 0-mV holding potential to −100 mV and then to test voltages between −100 and +100 mV in 10-mV increments before returning it to the holding potential. Dotted line indicates zero current.
F<sc>igure</sc> 2.
Figure 2.
Voltage dependence of steady-state IRK1 block by bis-QAC10. (A) Averaged I–V curves (mean ± SEM; n = 6) determined at the end of test pulses in the absence (control) or presence of various concentrations of bis-QA C10. (B) The fraction of current not blocked is plotted against bis-QA C10 concentration at the four representative voltages indicated. Curves through the data represent the equation I/Io = appKd/(appKd + [bis-QAC10]). (C) The natural logarithm of appKd is plotted against membrane voltage. The line through the data is a fit of Eq. 1a, yielding K1 = 3.10 ± 0.11 ×10⁻³ M (mean ± SEM; n = 6), K2 = 3.04 ± 0.72 × 10⁻², Z1 = 0.82 ± 0.03, and Z2 = 3.63 ± 0.20, where the overall appKd (0 mV) = K1K2. The dashed lines indicate the limiting slopes, and the vertical dotted line indicates zero voltage.
F<sc>igure</sc> 3.
Figure 3.
Kinetics of depolarization-induced IRK1 block by bis-QAC10. (A) Current transient elicited by stepping membrane voltage from −100 to 70 mV in the absence (control) or presence of 0.1 μM bis-QAC10; the first 3 ms of the transient in the presence of bis-QAC10 was omitted (see results). The curve superimposed on the transient (and back extrapolated to the start of depolarization) is a single-exponential fit. (B) The reciprocal of the time constant (mean ± SEM, n = 6) for channel block (1/τon), obtained as shown in A, is plotted against bis-QAC10 concentration (0.1, 1, and 10 μM) for four voltages. The lines through the data are linear fits whose slope gives the apparent second-order rate constant (appkon) for blocker binding. (C) The natural logarithm of appkon from B is plotted against membrane voltage. The line through the data is a fit of the Boltzmann function, yielding kon(0 mV) = 1.63 ± 0.37 × 10⁷ M−1s−1 (mean ± SEM, n = 6) and zon = 0.73 ± 0.07.
F<sc>igure</sc> 4.
Figure 4.
Kinetics of hyperpolarization-induced unblock of IRK1 channels in the presence of bis-QAC10. (A) Current transient elicited by stepping membrane voltage from 100 to −40 mV in the presence of 1 mM bis-QAC10, where the first 0.3 ms of the trace was omitted. The curve superimposed on the transient (and back extrapolated to the start of depolarization) is a single-exponential fit. (B) The natural logarithm of the reciprocal of the time constants (mean ± SEM; n = 3) for channel unblock (1/τoff, an estimate of the apparent off rate constant appkoff), obtained as shown in A, is plotted against bis-QAC10 concentration for five voltages. The lines through the data represent, for a given voltage, the average over the three concentrations tested. (C) The natural logarithm of the average appkoff from B is plotted against membrane voltage. The line through the data is a fit of the Boltzmann function, yielding koff(0 mV) = 1.06 ± 0.07 × 10² s−1 (mean ± SEM, n = 3) and zoff = 1.46 ± 0.02.
F<sc>igure</sc> 5.
Figure 5.
Extracellular K+ sensitivity of hyperpolarization-induced unblock kinetics in the presence of bis-QAC10. Normalized current transients elicited by stepping membrane voltage from 100 to −70 mV in the presence of 0.1 mM bis-QAC10 and either 100 or 10 mM extracellular K+, where the first 0.1 or 0.3 ms of the record was omitted. The 10 mM K+ extracellular solution contained 90 mM Na+; the intracellular solution contained 100 mM K+ in both cases. The curves superimposed on the current transients are single-exponential fits. From these and similar fits, we obtained time constants of 0.15 ± 0.02 and 4.59 ± 0.27 ms (mean ± SEM; n = 3 and 4) for 100 and 10 mM extracellular K+, respectively.
F<sc>igure</sc> 6.
Figure 6.
Voltage dependence of steady-state IRK1 block by spermine. (A) Chemical structure of spermine is shown on top. IRK1 currents recorded from a single patch in the absence (control) then presence of 100 μM spermine were elicited with the same voltage protocol as in Fig. 1. Dotted line indicates zero current. (B) The fraction of current (mean ± SEM, n = 9) not blocked by 100 μM spermine is plotted against membrane voltage. The curve through the data is a fit of Eq. 1, yielding K1 = 1.30 ± 0.06 × 10⁻⁴ M (mean ± SEM, n = 9), K2 = 1.44 ± 0.13 × 10⁻², Z1 = 0.40 ± 0.02, and Z2 = 4.23 ± 0.13, where the overall appKd (0 mV) = K1K2.
F<sc>igure</sc> 7.
Figure 7.
Kinetics of depolarization-induced IRK1 block by spermine. (A) Current transient elicited by stepping membrane voltage from −100 to 80 mV in the absence (control) or presence of 0.1 μM spermine, where the first 3 ms of the record in the presence of spermine was omitted, and the curve superimposed on the transient is a single-exponential fit. (B) The natural logarithm of appkon, obtained with the method shown in Fig. 3, B and C, from data such as shown in A, is plotted against membrane voltage. The line through the data is a fit of the Boltzmann function, yielding kon(0 mV) = 6.47 ± 0.30 × 10⁸ M−1s−1 (mean ± SEM, n = 23) and zon = 0.16 ± 0.02.
F<sc>igure</sc> 8.
Figure 8.
Kinetics of hyperpolarization-induced unblock of IRK1 channels in the presence of spermine. (A) Current transient elicited by stepping membrane voltage from 100 to −40 mV in the presence of 1 μM spermine, where the first 0.3 ms of the trace was omitted. The curve superimposed on the transient is a single-exponential fit. (B) The natural logarithm of the reciprocal of the time constants (mean ± SEM; n = 6) for channel unblock (1/τoff, an estimate of the apparent rate constant appkoff), obtained as shown in A, is plotted against spermine concentration for six voltages. The lines through the data represent, for a given voltage, the average over the three concentrations tested. (C) The natural logarithm of average appkoff from B is plotted against membrane voltage. The line through the data is a fit of the Boltzmann function, yielding koff(0 mV) = 5.34 ± 0.80 × 10² s−1 (mean ± SEM, n = 6) and zoff = 1.18 ± 0.08.
F<sc>igure</sc> 9.
Figure 9.
Kinetic model for spermine or bis-QAC10 block of the IRK1 channel. Binding of a blocker (B) to a channel (Ch) produces two sequentially related blocked states (ChB1 and ChB2). Top, cartoon representing the three channel states (see also Guo et al., 2003; Guo and Lu, 2003; Lu, 2004). The position of K+ ions (maximally totaling five) in the inner pore is arbitrary. The rate constants (kx) and associated valences (zx) for each blocker are tabulated below.
F<sc>igure</sc> 10.
Figure 10.
Distribution of the two blocked states of the model in Fig. 9 as a function of voltage. The relative distributions of the first (dashed curve) and second (solid curve) blocked states, computed using Eq. 2 and the parameters K2 (=[ChB1]/[ChB2]) = 1.44 × 10⁻² and Z2 = 4.23 obtained from a fit of Eq. 1 to the data of Fig. 6 B, are plotted against membrane voltage.
F<sc>igure</sc> 11.
Figure 11.
Expanded version of model in Fig. 9 where the blocker spermine exists in two protonation forms. In the more protonated (more charged) form spermine (SPM) traverses the pore at a low rate (k−4 ∼ 10 s−1). K3 (∼10−5 M) is the equilibrium dissociation constant for binding of the less protonated (non or much less permeating) form of spermine (SPM*) to the channel (Kb 1 in Guo and Lu, 2000b). Values of rate constants and valences for other transitions are as in Fig. 9.

Similar articles

Cited by

References

    1. Armstrong, C.M., and L. Binstock. 1965. Anomalous rectification in the squid giant axon injected with tetraethylammonium chloride. J. Gen. Physiol. 48:859–872. - PMC - PubMed
    1. Ashcroft, F.M. 2000. Ion Channels and Disease: Channelopathies. Academic Press, San Diego. 481 pp.
    1. Carter, P.J., G. Winter, A.J. Wilkinson, and A.R. Fersht. 1984. The use of double mutants to detect structural changes in the active site of the tyrosyl-tRNA synthetase (Bacillus stearothermophilus). Cell. 38:835–840. - PubMed
    1. Dibb, K.M., T. Rose, S.Y. Makary, T.W. Claydon, D. Enkvetchakul, R. Leach, C.G. Nichols, and M.R. Boyett. 2003. Molecular basis of ion selectivity, block, and rectification of the inward rectifier Kir3.1/Kir3.4 channel. J. Biol. Chem. 278:49537–49548. - PubMed
    1. Fakler, B., U. Brandle, E. Glowatzki, S. Weidemann, H.P. Zenner, and J.P. Ruppersberg. 1995. Strong voltage-dependent inward rectification of inward rectifier K+ channels is caused by intracellular spermine. Cell. 80:149–154. - PubMed

Publication types

MeSH terms