. 2005 Apr;25(8):3209-19.
doi: 10.1128/MCB.25.8.3209-3219.2005.

Histone dynamics on the interleukin-2 gene in response to T-cell activation

Affiliations

Histone dynamics on the interleukin-2 gene in response to T-cell activation

Xinxin Chen et al. Mol Cell Biol. 2005 Apr.

Abstract

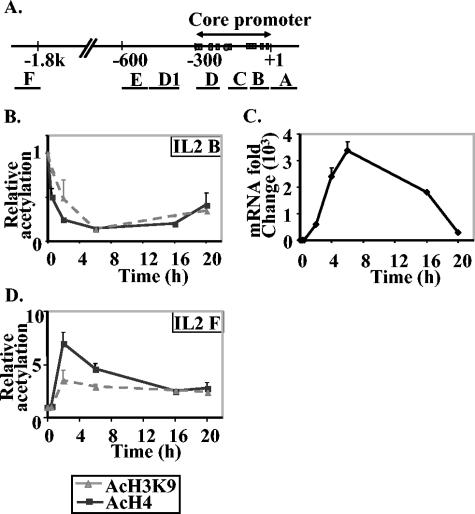
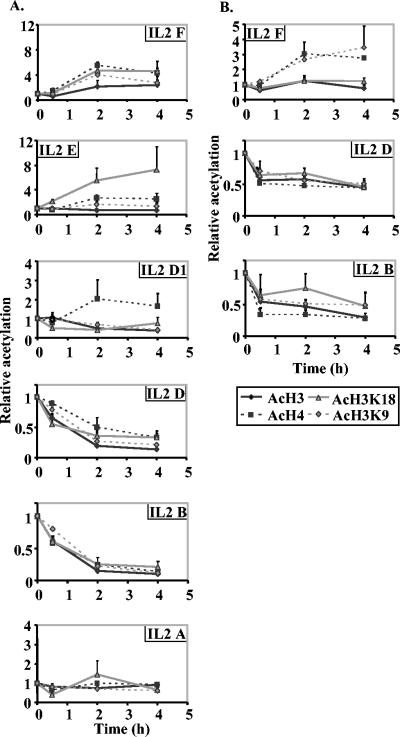
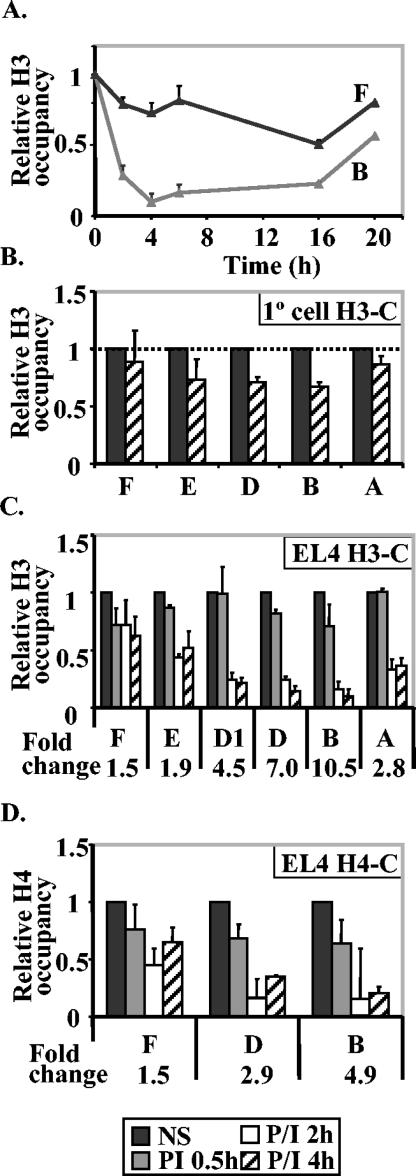
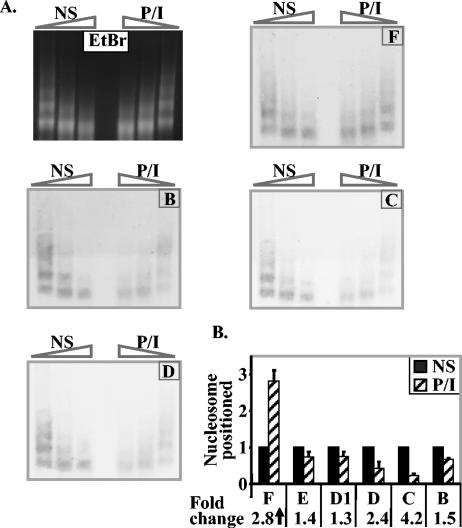
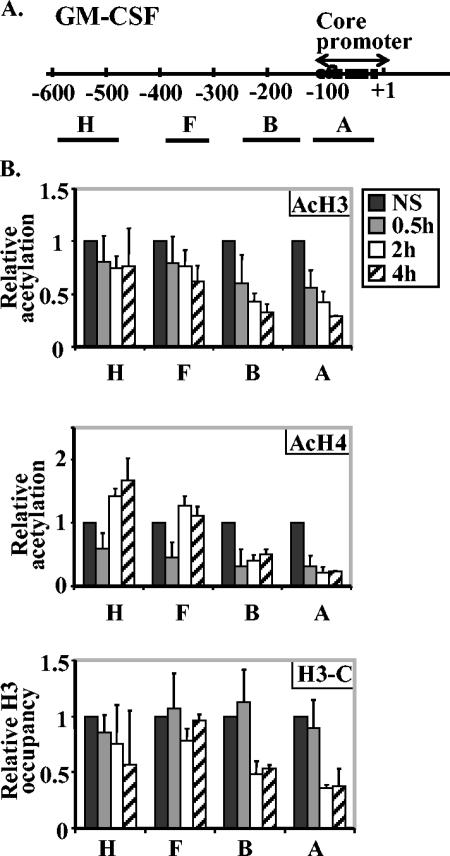
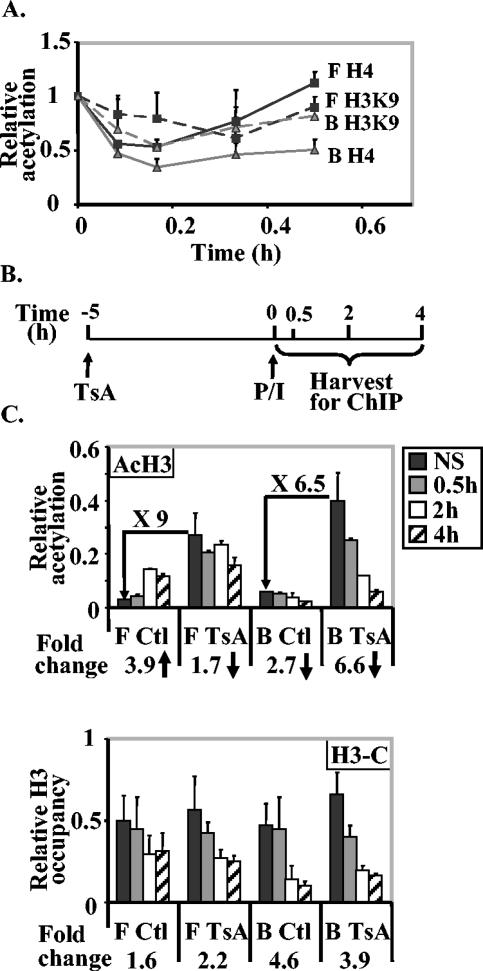
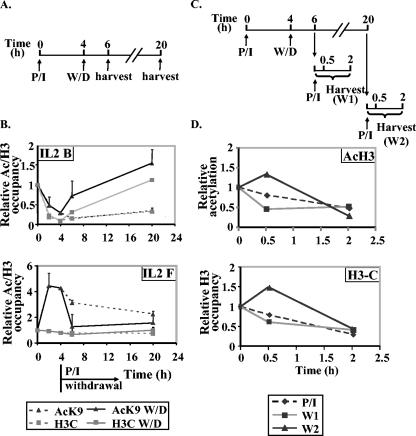
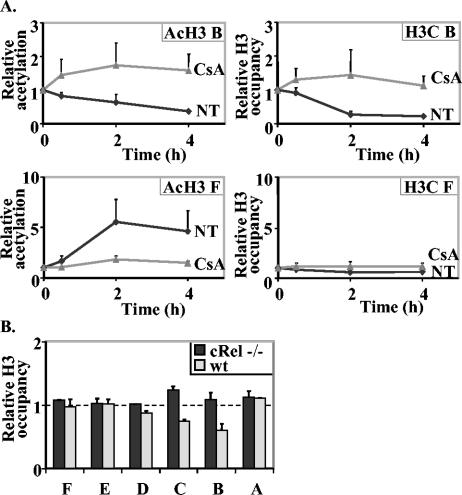
Several models have been proposed for the mechanism of chromatin remodelling across the promoters of inducible genes in mammalian cells. The most commonly held model is one of cooccupation where histone proteins are modified by acetylation or phosphorylation and nucleosomes are remodelled, allowing the assembly of transcription factor complexes. Using chromatin immunoprecipitation, we observed an apparent decrease of histone acetylation and phosphorylation signals at the proximal promoter region of the inducible interleukin-2 and granulocyte-macrophage colony-stimulating factor genes in response to T-cell activation. We showed that this apparent decrease was due to a loss of histone H3 and H4 proteins corresponding to a decrease in nucleosome occupation of the promoter. This histone loss is reversible; it is dependent on the continual presence of appropriate activating signals and transcription factors and is not dependent on the acetylation status of the histone proteins. These data show for the first time that histone proteins are lost from a mammalian promoter upon activation of transcription and support a model of activation-dependent disassembly and reassembly of nucleosomes.


Figures

FIG. 1.
FIG. 1.
Time course of acetylation of histone H3K9 and histone H4 on the IL-2 gene during transcription activation. (A) Diagram of the IL-2 gene promoter and upstream regions. The regions amplified by IL-2 primer sets designed for real-time PCR (Table 1) are indicated by the lines labeled A to F under the map. (B and D) Time course of acetylation of histone H3K9 (AcH3K9) and histone H4 (AcH4) at the B and F regions (shown in panel A) on the IL-2 gene during gene activation. Enrichment of specific DNA sequences in chromatin immunoprecipitates was detected by real-time PCR. The data are presented as the ratios of immunoprecipitated DNA to total input DNA and normalized to the unstimulated cell sample, which was set at a value of 1. The data presented are the combined means ± standard errors (error bars) of replicate PCR values from three independent experiments. (C) Time course of IL-2 mRNA expression in EL-4 T cells. SYBR green real-time PCR was performed on cDNA from unstimulated and P/I-stimulated EL-4 T cells for the time points indicated. The CT values generated for each time point were quantified using a standard curve generated with cDNA and normalizing to GAPDH.
FIG. 2.
FIG. 2.
Histone acetylation on the IL-2 gene during transcription activation in EL-4 cells and CD4+ primary T cells. (A) ChIP assays were performed with anti-acetylated histone H3 (AcH3), anti-acetylated histone H4 (AcH4), anti-acetylated histone H3K9 (AcH3K9), and anti-acetylated histone H3K18 (ACH3K18) antibodies using unstimulated EL-4 cells or cells stimulated for 30 min, 2 h, and 4 h. Real-time PCR analysis was performed on the immunoprecipitated DNA with the IL-2 primer sets amplifying different regions along the IL-2 gene (Fig. 1A and Table 1). The data are presented as the ratios of immunoprecipitated DNA to total input DNA and normalized to the unstimulated sample, which was set at a value of 1. The combined means ± standard errors (error bars) of replicate CT values from three independent experiments are shown. (B) ChIP experiments were performed on CD4+ primary T cells with the same antibodies as in panel A. Immunoprecipitated samples were amplified with primer sets B, D, and F and the data presented as in panel A.
FIG. 3.
FIG. 3.
Histones are lost from the IL-2 promoter after T-cell activation. (A) ChIP assay was performed with an antibody against the C terminus of histone H3 on EL-4 cells stimulated with P/I for the times shown. Real-time PCR was performed on the proximal promoter (IL-2 primer set B) and on the −2-kb upstream region (IL-2 primer set F). The data are plotted as the ratio of immunoprecipitated DNA to total input DNA and normalized to the unstimulated cell value, which was set at 1. (B) ChIP assay was performed on primary (1°) CD4+ T cells either left unstimulated or stimulated with P/I for 4 h and DNA amplified with the IL-2 primer sets shown. Data are presented as in panel A. (C and D) ChIP assays were performed with an antibody against the C terminus of histone H3 (H3-C) (C) and an antibody against the C terminus of histone H4 (H4-C) (D) on EL-4 cells unstimulated or stimulated for 30 min, 2 h, and 4 h. Real-time PCR analysis was performed with the immunoprecipitated DNA with IL-2 primers amplifying the regions indicated along the IL-2 gene (Fig. 1A). The CT value was converted to the relative difference (fold) in copy number and then normalized against the value for nonstimulated (NS) cells, which was set at 1 for each primer set. The change (fold) from the nonstimulated cell sample to the cell sample stimulated for 4 h is shown below the graph for each gene region.
FIG. 4.
FIG. 4.
Increased MNase accessibility and decreased mononucleosome density on the IL-2 promoter after T-cell activation. (A) EL-4 T cells were stimulated with P/I for 4 h, and genomic DNA from nonstimulated (NS) and stimulated cells (P/I) was subjected to limited digestion with increasing amounts of MNase to generate a nucleosome ladder visualized by ethidium bromide (EtBr) staining. Southern blots of this DNA were probed with labeled probes representing each of the IL-2 gene regions shown on the diagram. Bands were visualized with enhanced chemiluminescence. (B) Genomic DNA from nonstimulated or P/I-stimulated EL-4 cells was digested to mononucleosome-sized fragments with MNase, and the mononucleosome fraction was purified and subjected to quantitative PCR analysis with the IL-2 primer sets shown. Data are presented for each IL-2 primer set relative to the amount of product in the unstimulated samples. The data are the means ± standard errors (error bars) of three independent experiments, and the change (fold) from the value for nonstimulated cells is shown below the graph.
FIG. 5.
FIG. 5.
Histone proteins are lost across the GM-CSF promoter after EL-4 T-cell activation. (A) Diagram of the GM-CSF gene promoter showing the transcription start site (+1) and the defined core promoter region. The regions amplified by GM-CSF PCR primer sets are shown by the lines labeled with capital letters under the map. The sequences of the GM-CSF PCR primer sets are shown in Table 1. (B) EL-4 cells were left nonstimulated (NS) or stimulated with P/I for 30 min, 2 h, or 4 h, and ChIP assays were performed with antibodies directed against acetylated H3 (AcH3), acetylated-H4 (AcH4), and the C terminus of H3 (H3-C). The immunoprecipitated DNA was amplified with the primer sets shown. The data are shown relative to total input DNA and normalized to the value for nonstimulated cells for each GM-CSF primer set. The values represented the combined means ± standard errors (error bars) of three independent experiments.
FIG. 6.
FIG. 6.
Histone acetylation is not directly related to histone loss at the IL-2 gene promoter. (A) Time course of histone acetylation during the first 30 min of P/I activation of EL-4 T cells. Cells were stimulated with P/I for 5, 10, 20, and 30 min, and ChIP assays were performed with antibodies against acetylated H4 (solid lines) and acetylated H3K9 (stippled lines). Immunoprecipitated DNA was amplified with IL-2 primer sets B (grey) and F (black). The data are presented as the ratios of immunoprecipitated DNA to total input DNA and normalized to the value for the unstimulated cell sample, which was set at 1. The data presented are the combined means ± standard errors (error bars) of replicate PCR values from three independent repeats. (B) Schematic showing the time frame of treatment of cells with TsA followed by activation with P/I and the times of harvesting for ChIP assays. (C) Histone hyperacetylation does not promote histone loss at the IL-2 promoter. EL-4 cells were treated with TsA for 5 h and then not stimulated (NS) or stimulated with P/I for 30 min, 2 h, or 4 h. Cells were also activated without prior treatment with TsA (control [Ctl]). ChIP assays were performed with antibodies against acetylated H3 (AcH3) and the C terminus of H3 (H3-C), and the immunoprecipitated DNA was amplified with IL-2 primer sets B and F. Data are plotted as ratios of immunoprecipitated sample to total input sample. The increase (fold) in acetylation levels after TsA treatment and the fold decrease (fold) in total H3 after activation are also shown on or below the graph.
FIG. 7.
FIG. 7.
Histone removal is reversible and requires the continuous presence of the stimulus. (A) Schematic of the experiment to test the effect of stimulus withdrawal on histone loss from the IL-2 promoter. The times of stimulation (P/I), withdrawal (W/D), and harvest are shown. (B) EL-4 T cells were stimulated with P/I (stippled lines) for the times indicated. In parallel samples, the stimulus was removed after 4 h, and cells were harvested 2 h and 20 h later (solid lines). These samples were all subjected to ChIP assays with antibodies against acetylated H3K9 (AcK9) and the C terminus of H3 (H3C), and the immunoprecipitated DNA was amplified with IL-2 primer sets B and F. Data are presented as ratios of immunoprecipitated sample to total input normalized to unstimulated cell samples, which were given a value of 1. (C) Schematic of the experiment to test the effect of stimulus withdrawal and restimulation on histone loss at the IL-2 promoter. The times of stimulation (P/I), stimulus withdrawal (W/D), restimulation (P/I), and harvest are shown. (D) EL-4 cells were stimulated with P/I for 4 h, and the stimulus was withdrawn for a further 2 or 16 h and then restimulated with P/I for 30 min and 2 h. In parallel, untreated cells were stimulated for 30 min and 2 h with P/I. The amount of acetylated H3 (AcH3) and total H3 were measured by ChIP assays using IL-2 primer set B. Data are presented as ratios of immunoprecipitated sample to total input normalized to unstimulated cell samples, which were given a value of 1.
FIG. 8.
FIG. 8.
Transcription factor requirement for histone loss. (A) CsA inhibits histone loss from the IL-2 promoter. EL-4 cells were pretreated with CsA for 30 min prior to stimulation with P/I or stimulated with P/I alone (NT) for the times indicated. Cells were then subjected to ChIP assays with antibodies against acetylated H3 (AcH3) and C terminus of H3 (H3C), and the immunoprecipitated DNA was amplified with IL-2 primer sets B and F. The data are presented as the ratios of immunoprecipitated DNA to total input DNA and normalized to the unstimulated cell sample, which set at a value of 1. The data are the combined means ± standard errors (error bars) of replicate PCRs in two independent experiments. (B) The transcription factor c-Rel is required for histone loss at the IL-2 promoter. CD4+ T cells were purified from the spleens of wild-type (wt) mice and c-Rel−/− mice stimulated with P/I for 4 h and then subjected to ChIP assays with an antibody against the C terminus of H3. The immunoprecipitated DNA was amplified in PCRs with primer sets spanning the IL-2 gene. Data are presented as described above and show the means ± standard errors (error bars) of four replicate PCRs from a representative experiment.

Similar articles

Cited by

References

    1. Adkins, M. W., S. R. Howar, and J. K. Tyler. 2004. Chromatin disassembly mediated by the histone chaperone Asf1 is essential for transcriptional activation of the yeast PHO5 and PHO8 genes. Mol. Cell 14:657-666. - PubMed
    1. Agalioti, T., G. Chen, and D. Thanos. 2002. Deciphering the transcriptional histone acetylation code for a human gene. Cell 111:381-392. - PubMed
    1. Arney, K. L., and A. G. Fisher. 2004. Epigenetic aspects of differentiation. J. Cell Sci. 117:4355-4363. - PubMed
    1. Attema, J. L., R. Reeves, V. Murray, I. Levichkin, M. D. Temple, D. J. Tremethick, and M. F. Shannon. 2002. The human IL-2 gene promoter can assemble a positioned nucleosome that becomes remodeled upon T cell activation. J. Immunol. 169:2466-2476. - PubMed
    1. Bernstein, B. E., C. L. Liu, E. L. Humphrey, E. O. Perlstein, and S. L. Schreiber. 2004. Global nucleosome occupancy in yeast. Genome Biol. 5:R62. - PMC - PubMed

Publication types

LinkOut - more resources