Resolving the energy paradox of chaperone/usher-mediated fibre assembly
- PMID: 15799718
- PMCID: PMC1180718
- DOI: 10.1042/BJ20050426
Resolving the energy paradox of chaperone/usher-mediated fibre assembly
Abstract
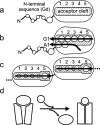
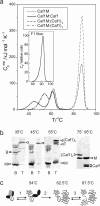
Periplasmic chaperone/usher machineries are used for assembly of filamentous adhesion organelles of Gram-negative pathogens in a process that has been suggested to be driven by folding energy. Structures of mutant chaperone-subunit complexes revealed a final folding transition (condensation of the subunit hydrophobic core) on the release of organelle subunit from the chaperone-subunit pre-assembly complex and incorporation into the final fibre structure. However, in view of the large interface between chaperone and subunit in the pre-assembly complex and the reported stability of this complex, it is difficult to understand how final folding could release sufficient energy to drive assembly. In the present paper, we show the X-ray structure for a native chaperone-fibre complex that, together with thermodynamic data, shows that the final folding step is indeed an essential component of the assembly process. We show that completion of the hydrophobic core and incorporation into the fibre results in an exceptionally stable module, whereas the chaperone-subunit pre-assembly complex is greatly destabilized by the high-energy conformation of the bound subunit. This difference in stabilities creates a free energy potential that drives fibre formation.
Figures


Similar articles
-
Fiber assembly by the chaperone-usher pathway.Biochim Biophys Acta. 2004 Nov 11;1694(1-3):259-67. doi: 10.1016/j.bbamcr.2004.02.010. Biochim Biophys Acta. 2004. PMID: 15546670 Review.
-
Caf1A usher possesses a Caf1 subunit-like domain that is crucial for Caf1 fibre secretion.Biochem J. 2009 Mar 15;418(3):541-51. doi: 10.1042/BJ20080992. Biochem J. 2009. PMID: 19032149
-
Structure and assembly of Yersinia pestis F1 antigen.Adv Exp Med Biol. 2007;603:74-87. doi: 10.1007/978-0-387-72124-8_6. Adv Exp Med Biol. 2007. PMID: 17966405 Review.
-
A novel self-capping mechanism controls aggregation of periplasmic chaperone Caf1M.Mol Microbiol. 2007 Apr;64(1):153-64. doi: 10.1111/j.1365-2958.2007.05644.x. Mol Microbiol. 2007. PMID: 17376079
-
Large is fast, small is tight: determinants of speed and affinity in subunit capture by a periplasmic chaperone.J Mol Biol. 2012 Apr 6;417(4):294-308. doi: 10.1016/j.jmb.2012.01.020. Epub 2012 Feb 1. J Mol Biol. 2012. PMID: 22321795
Cited by
-
Immunogenicity of a Yersinia pestis vaccine antigen monomerized by circular permutation.Infect Immun. 2006 Dec;74(12):6624-31. doi: 10.1128/IAI.00437-06. Epub 2006 Sep 18. Infect Immun. 2006. PMID: 16982834 Free PMC article.
-
Probing the oligomeric re-assembling of bacterial fimbriae in vitro: a small-angle X-ray scattering and analytical ultracentrifugation study.Eur Biophys J. 2021 May;50(3-4):597-611. doi: 10.1007/s00249-021-01543-3. Epub 2021 May 4. Eur Biophys J. 2021. PMID: 33948690 Free PMC article.
-
Mechanism of fibre assembly through the chaperone-usher pathway.EMBO Rep. 2006 Jul;7(7):734-8. doi: 10.1038/sj.embor.7400722. Epub 2006 Jun 9. EMBO Rep. 2006. PMID: 16767077 Free PMC article.
-
Reversible non-stick behaviour of a bacterial protein polymer provides a tuneable molecular mimic for cell and tissue engineering.Adv Mater. 2014 May;26(17):2704-9, 2616. doi: 10.1002/adma.201304645. Epub 2014 Mar 13. Adv Mater. 2014. PMID: 24623384 Free PMC article.
-
Functional and structural characteristics of bacterial proteins that bind host cytokines.Virulence. 2017 Nov 17;8(8):1592-1601. doi: 10.1080/21505594.2017.1363140. Epub 2017 Aug 25. Virulence. 2017. PMID: 28783440 Free PMC article. Review.
References
-
- Thanassi D. G., Saulino E. T., Hultgren S. J. The chaperone/usher pathway: a major terminal branch of the general secretory pathway. Curr. Opin. Microbiol. 1998;1:223–231. - PubMed
-
- Knight S. D., Berglund J., Choudhury D. Bacterial adhesins: structural studies reveal chaperone function and pilus biogenesis. Curr. Opin. Chem. Biol. 2000;4:653–660. - PubMed
-
- Sauer F. G., Knight S. D., Waksman G., Hultgren S. J. PapD-like chaperones and pilus biogenesis. Semin. Cell Dev. Biol. 2000;11:27–34. - PubMed
-
- Sauer F. G., Barnhart M., Choudhury D., Knight S. D., Waksman G., Hultgren S. J. Chaperone-assisted pilus assembly and bacterial attachment. Curr. Opin. Struct. Biol. 2000;10:548–556. - PubMed
-
- Choudhury D., Thompson A., Stojanoff V., Langermann S., Pinkner J., Hultgren S. J., Knight S. D. X-ray structure of the FimC–FimH chaperone–adhesin complex from uropathogenic Escherichia coli. Science. 1999;285:1061–1066. - PubMed
Publication types
MeSH terms
Substances
Associated data
- Actions
LinkOut - more resources
Full Text Sources
Other Literature Sources

