

Functional genomic analysis of the rates of protein evolution
- PMID: 15800036
- PMCID: PMC555735
- DOI: 10.1073/pnas.0501761102
Functional genomic analysis of the rates of protein evolution
Erratum in
- Proc Natl Acad Sci U S A. 2006 May 16;103(20):7935
Abstract
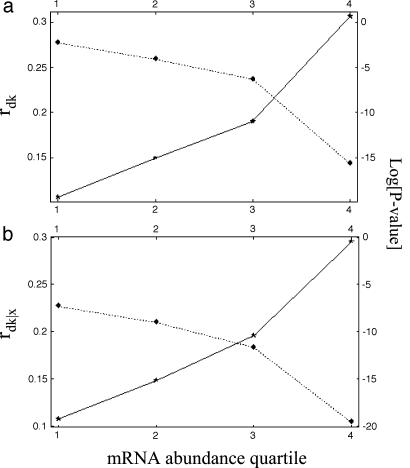
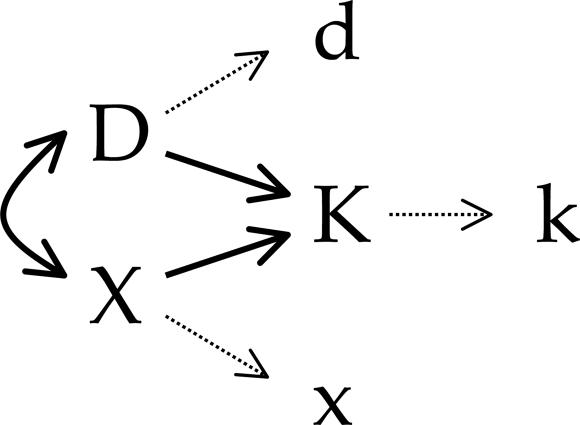
The evolutionary rates of proteins vary over several orders of magnitude. Recent work suggests that analysis of large data sets of evolutionary rates in conjunction with the results from high-throughput functional genomic experiments can identify the factors that cause proteins to evolve at such dramatically different rates. To this end, we estimated the evolutionary rates of >3,000 proteins in four species of the yeast genus Saccharomyces and investigated their relationship with levels of expression and protein dispensability. Each protein's dispensability was estimated by the growth rate of mutants deficient for the protein. Our analyses of these improved evolutionary and functional genomic data sets yield three main results. First, dispensability and expression have independent, significant effects on the rate of protein evolution. Second, measurements of expression levels in the laboratory can be used to filter data sets of dispensability estimates, removing variates that are unlikely to reflect real biological effects. Third, structural equation models show that although we may reasonably infer that dispensability and expression have significant effects on protein evolutionary rate, we cannot yet accurately estimate the relative strengths of these effects.
Figures
References
Publication types
MeSH terms
Substances
Grants and funding
LinkOut - more resources
Full Text Sources
Other Literature Sources
Molecular Biology Databases
