. 2005 Jun;16(6):3028-39.
doi: 10.1091/mbc.e04-12-1119. Epub 2005 Mar 30.

Galectin-3 is a downstream regulator of matrix metalloproteinase-9 function during endochondral bone formation

Affiliations

Galectin-3 is a downstream regulator of matrix metalloproteinase-9 function during endochondral bone formation

Nathalie Ortega et al. Mol Biol Cell. 2005 Jun.

Abstract

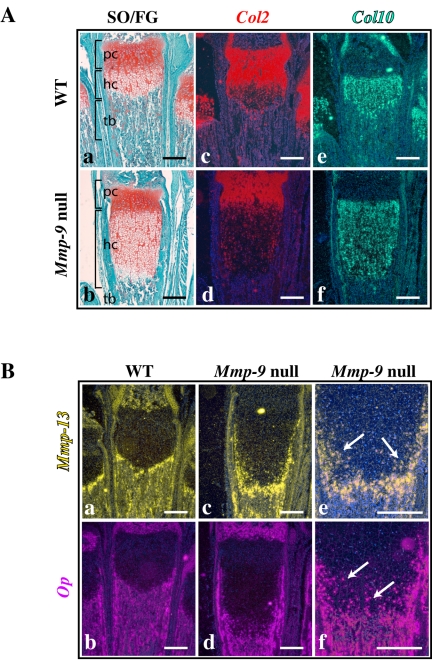
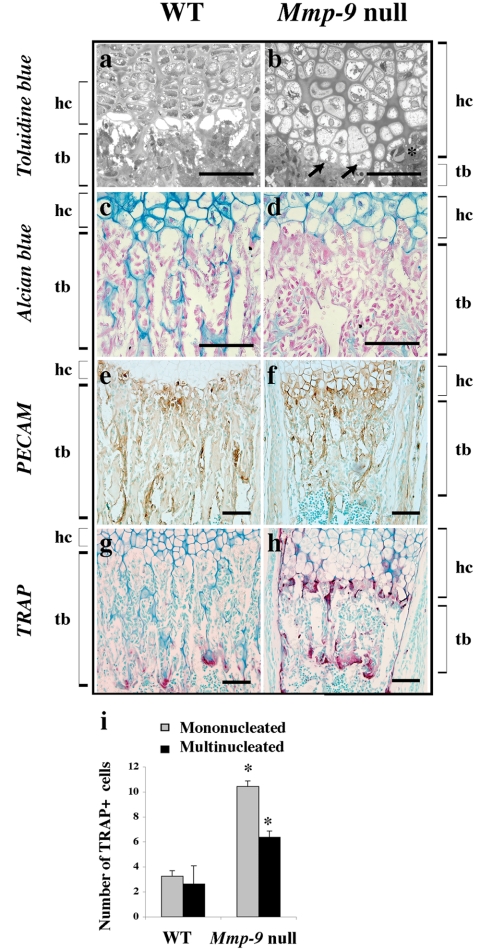
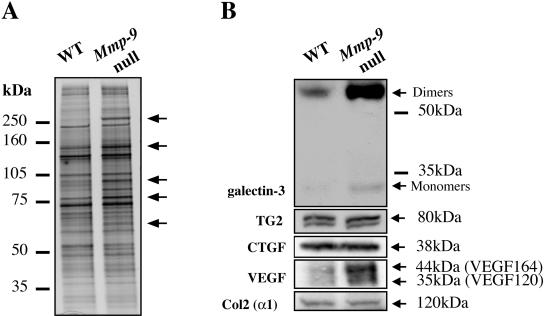
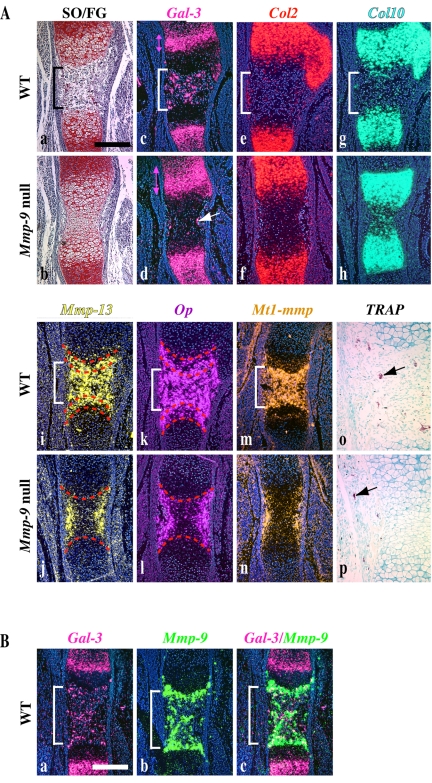
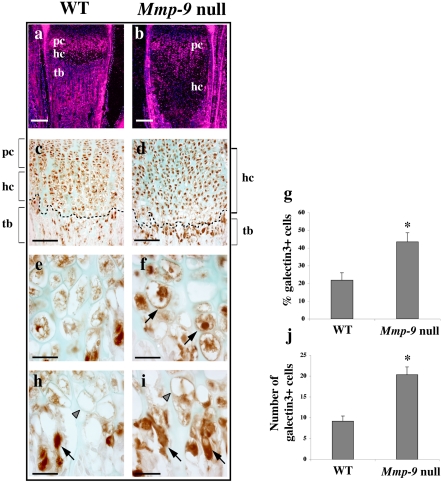
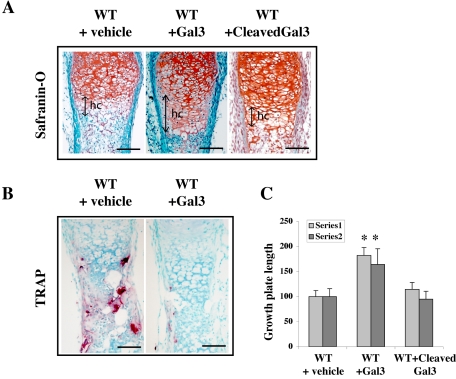
Endochondral bone formation is characterized by the progressive replacement of a cartilage anlagen by bone at the growth plate with a tight balance between the rates of chondrocyte proliferation, differentiation, and cell death. Deficiency of matrix metalloproteinase-9 (MMP-9) leads to an accumulation of late hypertrophic chondrocytes. We found that galectin-3, an in vitro substrate of MMP-9, accumulates in the late hypertrophic chondrocytes and their surrounding extracellular matrix in the expanded hypertrophic cartilage zone. Treatment of wild-type embryonic metatarsals in culture with full-length galectin-3, but not galectin-3 cleaved by MMP-9, mimicked the embryonic phenotype of Mmp-9 null mice, with an increased hypertrophic zone and decreased osteoclast recruitment. These results indicate that extracellular galectin-3 could be an endogenous substrate of MMP-9 that acts downstream to regulate hypertrophic chondrocyte death and osteoclast recruitment during endochondral bone formation. Thus, the disruption of growth plate homeostasis in Mmp-9 null mice links galectin-3 and MMP-9 in the regulation of the clearance of late chondrocytes through regulation of their terminal differentiation.


Figures

Figure 1.
Figure 1.
Accumulation of late terminally differentiated hypertrophic chondrocytes in Mmp-9 null mice. Serial sections of growth plates from 2-wk-old MMP-9 null and WT mice. (A) Safranin O/Fast Green (SO/FG) staining (a and b) and in situ hybridization with antisense probes for collagen type II (Col2; c and d) and collagen type X (Col10; e and f) show an increase in the hypertrophic chondrocyte zone (hc) but not the proliferating chondrocyte zone (pc) in MMP-9 null mice compared with WT. (B) In situ hybridization with antisense probes for late hypertrophic markers, Mmp-13 (a and c) and Osteopontin (Op; b and d) show the accumulation of late hypertrophic chondrocytes in MMP-9 null mice. (e and f) Higher magnification of Mmp-13 and Op expression pattern in MMP-9 null mice. Note that the accumulation of hypertrophic chondrocytes expressing these markers (arrows) in several rows at the chondro-osseous junction. pc, proliferating chondrocytes; hc, hypertrophic chondrocytes; tb, trabecular bone. Scale bars, 250 μm.
Figure 2.
Figure 2.
Altered organization of the chondro-osseous junction in Mmp-9 null mice. Histological analysis of the chondro-osseous junction. (a and b) Representative pictures of semithin sections stained with Toluidine blue showing the abnormal survival of the last row of hypertrophic chondrocyte (arrows) in Mmp-9 null mice compared with WT. A capillary in close contact with last transverse septa is marked by an asterisk (*). (c–h) Longitudinal sections through the central part of growth plates. (c and d) Alcian blue staining; note the decrease in staining in Mmp-9 null mice in the last row of hypertrophic chondrocytes and trabeculae. (e and f) PECAM staining showing no major differences in growth plate vascularization between Mmp-9 null and WT mice. (g and h) TRAP staining, note the increase in TRAP-positive cells recruited at the chondro-osseous junction in Mmp-9 null mice. hc, hypertrophic chondrocytes; tb, trabecular bone. Scale bars, 125 μm. (i) Quantification of mononuclear and multinucleated TRAP-positive cells recruited at the chondro-osseous junction, showing an increase in Mmp-9 null mice (n = 6 different metatarsals; *p ≤ 0.005).
Figure 3.
Figure 3.
Accumulation of uncleaved galectin-3 in the growth plate of Mmp-9 null mice. (A) Protein extracts from WT and Mmp-9 null hypertrophic chondrocyte zones were analyzed by SDS-PAGE and silver staining. Differences in protein profiles were observed as increases in the intensity of several bands in Mmp-9 null samples, as indicated by arrows. (B) Protein extracts from WT and Mmp-9 null hypertrophic chondrocyte zones were analyzed for expression of galectin-3, tissue transglutaminase (TG2), CTGF, VEGF, and α1 chain of collagen type II (Col2; α1) by Western blotting. Note the increase in intact galectin-3 dimers and VEGF in Mmp-9 null mice compared with WT samples.
Figure 4.
Figure 4.
Galectin-3 expression is disturbed during the initial stage of endochondral bone formation in Mmp-9 null mice. (A) Serial longitudinal sections of humeri from E15.0 WT and Mmp-9 null mice were stained with Safranin O/fast green (SO/FG; a and b) and for TRAP activity (o and p, TRAP-positive cells are indicated by black arrows). Adjacent sections were hybridized with antisense RNA probes for Galectin-3 (Gal-3, fuchsia), Collagen type 2 (Col2, red), Collagen type 10 (Col10, green), Mmp-13 (yellow), Osteopontin (Op, purple), or Mt1-mmp (orange). Note the increase in Galectin-3 expression in Mmp-9 null mice as indicated by double pink arrows. Rare Galectin-3–expressing cells are found in the perichondrium of Mmp-9 null samples (white arrow). Red dotted lines indicate the limits of Mmp-13 and Op expression domains in late HC. (B) Serial longitudinal sections of femurs from E16.0 WT mice were hybridized with antisense RNA probes for Galectin-3 and Mmp-9 as indicated. Merging of both signals shows partial overlap between Galectin-3 and Mmp-9 expression. Brackets indicate the primary ossification center in wild-type sections. Scale bars, (A) 250 μm; (B) 500 μm.
Figure 5.
Figure 5.
Galectin-3 accumulates at the chondro-osseous junction of Mmp-9 null mice. Paraffin sections of the growth plates of 2-wk-old Mmp-9 null and WT metatarsals. (a and b) In situ hybridization with antisense RNA probe for Galectin-3. (c and d) Immunostaining with monoclonal rat anti–galectin-3. (e and f) Higher magnification of (c and d) showing the increase in galectin-3 protein in hypertrophic chondrocytes (hc) of Mmp-9 null mice. Black arrows indicate galectin-3 staining in perilacunar space. (h and i) Higher magnification of (c and d) showing the increase in recruitment of galectin-3–positive cells at the chondro-osseous junction (indicated by dotted line) in Mmp-9 null mice (black arrows) and the increase in galectin-3 staining in the pericellular matrix of the last row of hypertrophic chondrocytes (gray arrowheads). (g) Quantification of hypertrophic chondrocytes exhibiting high levels of galectin-3 immunostaining. Results are expressed as percentage of total hypertrophic chondrocytes counted. (n = 6 different metatarsals; *p ≤ 0.005). (j) Quantification of galectin-3–positive cells recruited at the chondro-osseous junction expressed as total number of galectin-3–positive cells per section along the ossification front. (n = 6 different metatarsals; *p ≤ 0.005). pc, proliferating chondrocytes; hc, hypertrophic chondrocytes; tb, trabecular bone. Scale bars, (a and b, 250 μm); (c and d, 150 μm); (e, f, h, and i, 30 μm).
Figure 6.
Figure 6.
Ectopic addition of multimeric uncleaved galectin-3 partially mimics MMP-9 deficiency. Sections from E16.5 WT metatarsals cultured for 4 d in presence of vehicle alone, full-length mouse recombinant galectin-3–or MMP-9–cleaved galectin-3 stained with (A) Safranin O or (B) for TRAP activity. (C) Quantification of the increase in growth plate length following galectin-3 treatment. Results are expressed as the percentage of increase compared with untreated WT and the results from two representative independent experiments are shown (series 1, n = 5 for vehicle alone, n = 4 for full length galectin-3 and n = 4 for MMP-9 cleaved galectin-3), *p ≤ 0.005); (series 2, n = 5 for vehicle alone, n = 5 for full length galectin-3 and n = 3 for MMP-9 cleaved galectin-3, *p ≤ 0.005).

References

    1. Akahani, S., Nangia-Makker, P., Inohara, H., Kim, H. R., and Raz, A. (1997). Galectin-3, a novel antiapoptotic molecule with a functional BH1 (NWGR) domain of Bcl-2 family. Cancer Res. 57, 5272-5276. - PubMed
    1. Albrecht, U., Eichele, G., Helms, J. A., and Lu, H. (1997). Visualization of gene expression patterns by in situ hybridization. In: Molecular and Cellular Methods in Developmental Toxicology, ed. G. Daston, Boca Raton, FL: CRC Press, 23-48.
    1. Aubin, J. E., Gupta, A. K., Bhargava, U., and Turksen, K. (1996). Expression and regulation of galectin 3 in rat osteoblastic cells. J. Cell Physiol. 169, 468-480. - PubMed
    1. Barleon, B., Sozzani, S., Zhou, D., Weich, H. A., Mantovani, A., and Marme, D. (1996). Migration of human monocytes in response to vascular endothelial growth factor (VEGF) is mediated via the VEGF receptor flt-1. Blood 87, 3336-3343. - PubMed
    1. Barondes, S. H. et al. (1994). Galectins: a family of animal beta-galactoside-binding lectins. Cell 76, 597-598. - PubMed

Publication types

MeSH terms

Substances