Comparative Study
. 2005 Mar 30;25(13):3312-22.
doi: 10.1523/JNEUROSCI.4262-04.2005.

Amantadine inhibits NMDA receptors by accelerating channel closure during channel block

Affiliations
Comparative Study

Amantadine inhibits NMDA receptors by accelerating channel closure during channel block

Thomas A Blanpied et al. J Neurosci. .

Abstract

The channel of NMDA receptors is blocked by a wide variety of drugs. NMDA receptor channel blockers include drugs of abuse that induce psychotic behavior, such as phencyclidine, and drugs with wide therapeutic utility, such as amantadine and memantine. We describe here the molecular mechanism of amantadine inhibition. In contrast to most other described channel-blocking molecules, amantadine causes the channel gate of NMDA receptors to close more quickly. Our results confirm that amantadine binding inhibits current flow through NMDA receptor channels but show that its main inhibitory action at pharmaceutically relevant concentrations results from stabilization of closed states of the channel. The surprising variation in the clinical utility of NMDA channel blockers may in part derive from their diverse effects on channel gating.


Figures
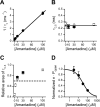
Figure 2.
Figure 2.
Estimation of the k+, k-, and IC50 of amantadine from outside-out patch experiments. Recordings were made in 5 μm NMDA plus 10 μm glycine with the indicated concentration of amantadine. A, Dependence on amantadine concentration of reciprocal τo. Mean values based on a total of 48 measurements from 12 patches are plotted; in most cases, error bars are smaller than points. The slope of a linear regression fit through all data points (line), 40.8 μm-1s-1, was used to estimate k+. B, Dependence on amantadine concentration of the shortest duration component of the closed-time distribution. Open squares show the mean of all data points at each concentration; filled circles show the mean of just those that met the two criteria described in Materials and Methods. The line is drawn at the mean of all data points. C, Dependence on amantadine concentration of the area of the short-duration component as a proportion of the total area of the three closed-time histogram components. Symbols are as in B. The dashed line indicates that histograms in which the proportional area of τC,B was <0.7 were excluded from calculation of k- (see Materials and Methods). D, IC50 for amantadine inhibition of NMDA responses in patches. Normalized n × Popen equals n × Popen in the plotted amantadine concentration divided by n × Popen measured in the same patch in 0 amantadine. Line is best fit of Equation 1 to the data. Data were pooled from all patch measurements, as in A.
Figure 3.
Figure 3.
The effects of a trapping blocker on receptor state transitions help determine IC50. A, Schematic of model 1. R is the NMDA receptor, A is an NMDA molecule, B is an amantadine molecule, A2D is the desensitized receptor, and A2R* is a receptor in the open conformation. Symbols used for each rate constant (k) are shown in the model. Equilibrium constants were defined as follows: for NMDA binding, Ka = ka-/ka+ and Ka = ka-/ka+; for channel gating, Kg = α/β and Kg = α′/β′; for desensitization, Kds = kds-/kds+ and Kds = kds-/kds+; for amantadine binding, Kd = k-/k+. B, Model 1 was used to investigate how the IC50 of a trapping channel blocker is influenced by the effects of the blocker on channel gating with [A] = 5 μm. Predicted concentration-response curves (see Materials and Methods) are plotted for a blocker with Kd = 110 μm that has no effect on channel gating when bound (Kg = Kg = 39; solid line), that stabilizes the channel open state (Kg = 0.1 × Kg; dashed line), and that stabilizes the channel closed state (Kg = 10 × Kg; dotted line). In all plots, Ka = Ka = 11 μm and Kds = Kds = 0.2.C, Model 1 was used to determine that a blocker with Kd = 110 μm can achieve an IC50 of 38.9 μm by decreasing agonist affinity (Ka = 2.35 × Ka = 25.9 μm) alone, by stabilizing the channel closed state (Kg = 2.83 × Kg = 110) alone, or by stabilizing the desensitized state (Kds = 0.152 × Kds = 0.0304) alone.
Figure 4.
Figure 4.
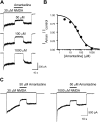
Inhibition of whole-cell responses by amantadine in elevated NMDA concentrations. A, Whole-cell current records of inhibition of responses activated by 30 μm NMDA plus 10 μm glycine with the indicated concentrations of amantadine. All traces are from the same cell. Lines above traces indicate the time of application of NMDA and amantadine. B, Example of an amantadine concentration-inhibition curve from a single cell (same cell as used for traces in A). IAman/Icontrol is the steady-state current in agonists plus amantadine divided by current in agonists alone and was measured as shown in A and C. Current in agonists alone was calculated as the average of the steady-state currents in agonists measured before and after application of amantadine. The line is the best fit of Equation 1 to the data. Similar concentration-response curves with amantadine at six to seven concentrations from 1 to 1000 μm were used to estimate amantadine IC50 in 30 μm NMDA. C, Examples of inhibition by 50 μm amantadine of responses activated by 30 μm NMDA plus 10 μm glycine and by 1000 μm NMDA plus 10 μm glycine.
Figure 5.
Figure 5.
Predicted and measured dependence of amantadine IC50 on NMDA concentration. The solid line shows the prediction of model 1 when each blocked channel equilibrium constant equaled the corresponding unblocked channel equilibrium constant (Ka = Ka = 11 μm; Kg = Kg = 39; Kds = Kds = 0.2). The other three lines each show predictions after adjustment of an equilibrium constant to yield the previously measured (Blanpied et al., 1997) amantadine IC50 of 38.9 μm in 5 μm NMDA (see legend to Fig. 3C). Equilibrium constant adjustments were as follows: Ka to 25.9 μm (long dashes), Kg to 110 (short dashes), or Kds to 0.0304 (dotted line). Each of these manipulations decreased the proportion of blocked channels in the open state at equilibrium. The closed circles show the mean values of amantadine IC50 measured in the presence of the indicated NMDA concentrations plus 10 μm glycine.
Figure 6.
Figure 6.
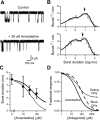
Effect of amantadine on channel gating. A, Bursts of single-channel openings activated by NMDA in 0 (top) and 30 μm (bottom) amantadine from a single patch. B, Burst-duration histograms derived from the patch used for A in 0 (top) and 30 μm (bottom) amantadine. The solid lines are double-exponential fits to each histogram. Arrows indicate the arithmetic mean burst length in control (8.46 ms) and 30 μm amantadine (5.63 ms). C, Dependence on amantadine concentration of arithmetic mean burst duration. Points are measured burst duration; each point represents averages of data from 4-10 patches. The solid line is the best fit of Equation 2 to burst-duration values, with k+ and k- fixed at their measured values (40.8 μm-1s-1 and 4480 s-1, respectively) and α fixed at 126 s-1 (inverse of measured control mean burst duration). The best fit was achieved with α′ (the only free parameter) = 251 s-1, or 1.99 × α. The dotted line shows the predicted mean burst duration from Equation 2 with k+, k-, and α set to the values given above and α′ set to 357 s-1 (= 2.83 × α; see legend to Fig. 3C). D, Predicted concentration-inhibition curves for three inhibitors are compared: “Amantadine” (solid line) binds to the open channel (Kd = 110 μm), blocks current flow when bound, and stabilizes the channel closed state (Kg = 2.83 × Kg); “Block Only” (dashed line) binds to the open channel (Kd = 110 μm), blocks current flow when bound, but has no effect on channel gating; “Gating Only” (dotted line) binds to the open channel (Kd = 110 μm), does not block current flow when bound, but stabilizes the channel closed state (Kg = 2.83 × Kg). Predicted curves were derived (see supplemental material, available at www.jneurosci.org) from model 1 with [A] = 5 μm, Ka = Ka, and Kds = Kds; Ka, Kg, and Kds were fixed at values given in Materials and Methods.
Figure 1.
Figure 1.
Amantadine causes flickering channel block of NMDA receptors. A, Outside-out patch-clamp records of channel openings activated at -67 mV by 5 μm NMDA plus 10 μm glycine with 0, 10, and 100 μm amantadine. Lines above the top trace of each pair indicate a region shown on a faster time scale in the bottom trace. All traces are from a single patch. B, Open-time histograms from the patch shown in A at the corresponding amantadine concentrations. Lines are single-exponential fits to the histograms. C, Closed-time histograms from the patch shown in A. Lines are triple-exponential fits to the histogram. Note the change in scale in the y-axis in the bottom graph.
Figure 7.
Figure 7.
After a rapid depolarizing voltage step, unblock of amantadine from NR1/NR2B receptors contains a prominent slow component. A, B, Superimposed whole-cell currents from transfected HEK 293T cells during a voltage jump from -67 to 40 mV in 30 μm NMDA plus 10 μm glycine with the following: A, 0 (thin trace) or 100 μm (thick trace) amantadine; B, 100 μm amantadine (thick trace) or 100 μm Mg2+o (thin trace). Cells were exposed to the indicated external solution starting 15 s before the voltage jump. Currents were leak and capacitive subtracted using identical voltage steps made in the presence of blocker but in the absence of agonists. In A, currents are not normalized; in B, currents were normalized and shifted so that currents were equal before the voltage jump and also at steady state at 40 mV (not visible in plotted section of traces). Normalization was particularly important to remove differences attributable to Mg2+o potentiation of NR1/NR2B receptors (Paoletti et al., 1995).

Similar articles

Cited by

References

    1. Anson LC, Schoepfer R, Colquhoun D, Wyllie DJ (2000) Single-channel analysis of an NMDA receptor possessing a mutation in the region of the glutamate binding site. J Physiol (Lond) 527: 225-237. - PMC - PubMed
    1. Antonov SM, Johnson JW (1996) Voltage-dependent interaction of open-channel blocking molecules with gating of NMDA receptors in rat cortical neurons. J Physiol (Lond) 493: 425-445. - PMC - PubMed
    1. Antonov SM, Johnson JW (1999) Permeant ion regulation of N-methyl-d-aspartate receptor channel block by Mg2+ Proc Natl Acad Sci USA 96: 14571-14576. - PMC - PubMed
    1. Antonov SM, Gmiro VE, Johnson JW (1998) Binding sites for permeant ions in the channel of NMDA receptors and their effects on channel block. Nat Neurosci 1: 451-461. - PubMed
    1. Ascher P, Nowak L (1988) The role of divalent cations in the N-methyl-d-aspartate responses of mouse central neurones in culture. J Physiol (Lond) 399: 247-266. - PMC - PubMed

Publication types

MeSH terms