Comparative Study
. 2005 Mar 30;25(13):3341-9.
doi: 10.1523/JNEUROSCI.0104-05.2005.

Molecular determinants for modulation of persistent sodium current by G-protein betagamma subunits

Affiliations
Comparative Study

Molecular determinants for modulation of persistent sodium current by G-protein betagamma subunits

Massimo Mantegazza et al. J Neurosci. .

Abstract

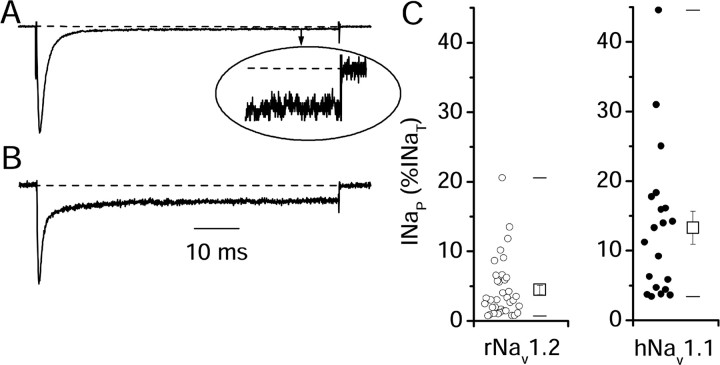
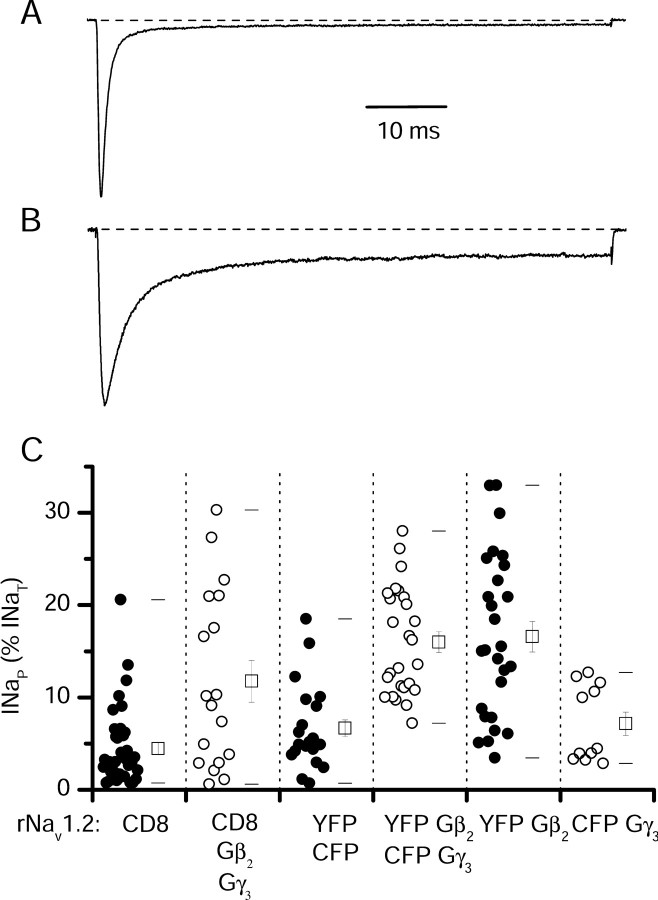
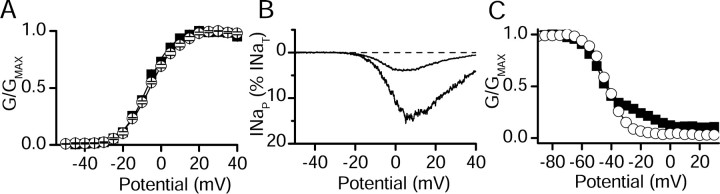
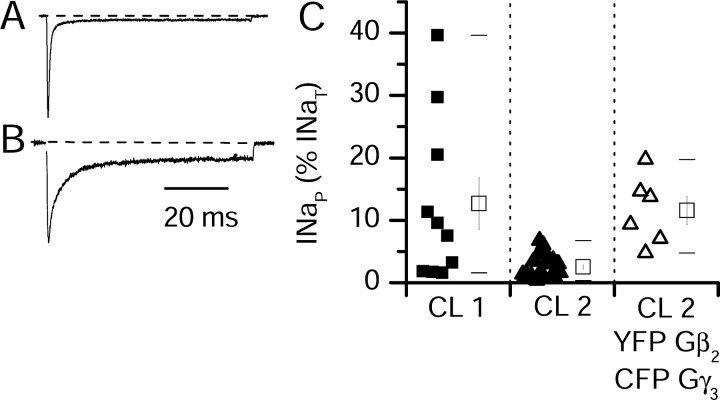
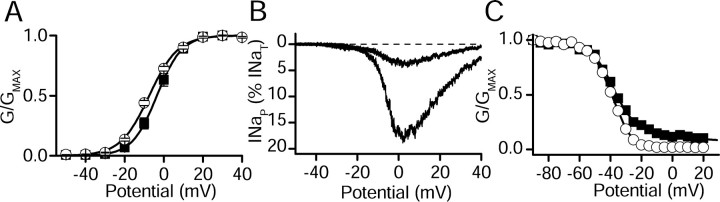
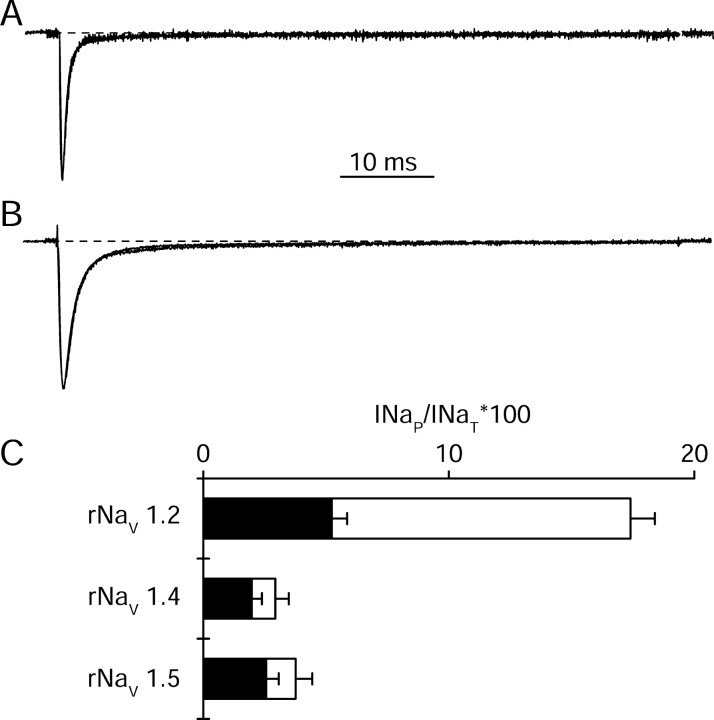
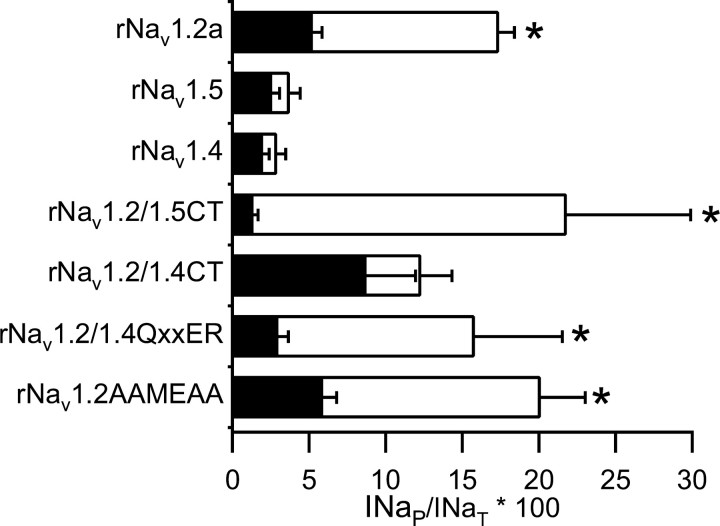
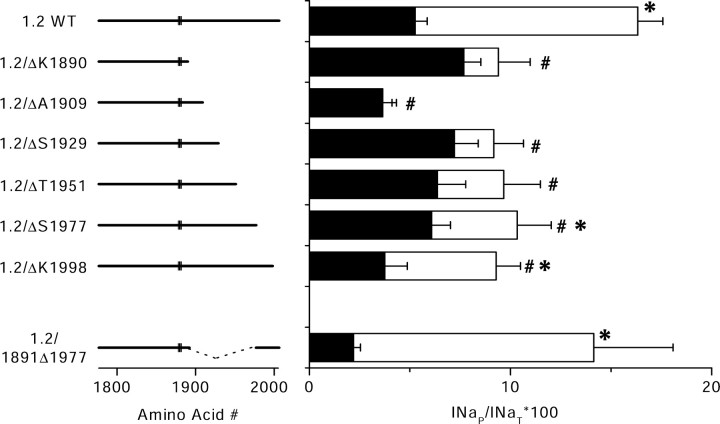
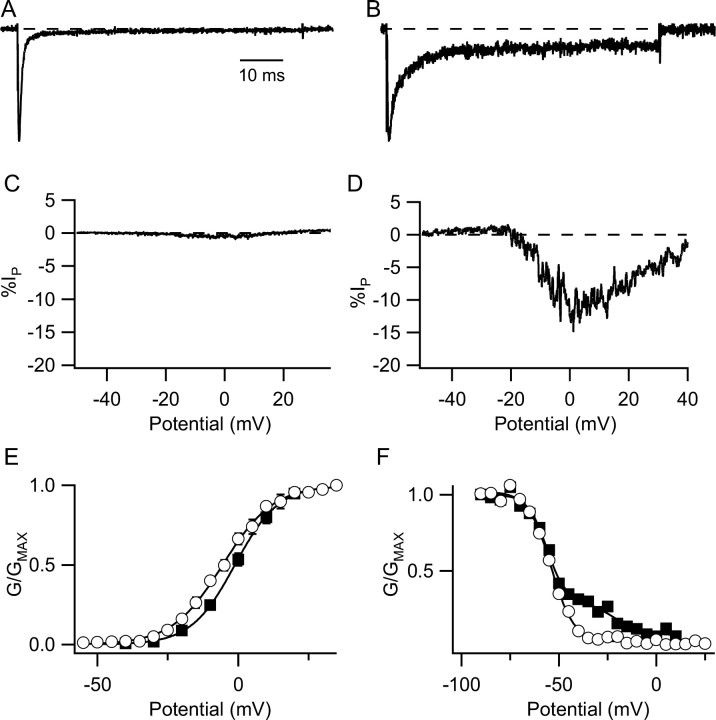
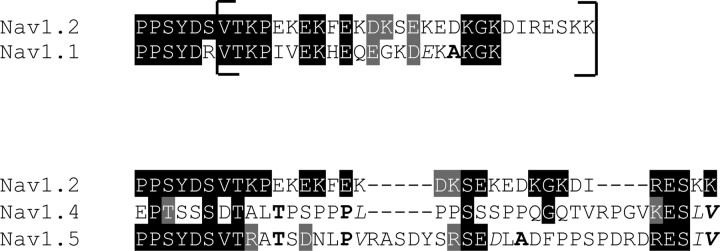
Voltage-gated sodium channels are responsible for the upstroke of the action potential in most excitable cells, and their fast inactivation is essential for controlling electrical signaling. In addition, a noninactivating, persistent component of sodium current, I(NaP), has been implicated in integrative functions of neurons including threshold for firing, neuronal bursting, and signal integration. G-protein betagamma subunits increase I(NaP), but the sodium channel subtypes that conduct I(NaP) and the target site(s) on the sodium channel molecule required for modulation by Gbetagamma are poorly defined. Here, we show that I(NaP) conducted by Na(v)1.1 and Na(v)1.2 channels (Na(v)1.1 > Na(v)1.2) is modulated by Gbetagamma; Na(v)1.4 and Na(v)1.5 channels produce smaller I(NaP) that is not regulated by Gbetagamma. These qualitative differences in modulation by Gbetagamma are determined by the transmembrane body of the sodium channels rather than their cytoplasmic C-terminal domains, which have been implicated previously in modulation by Gbetagamma. However, the C-terminal domains determine the quantitative extent of modulation of Na(v)1.2 channels by Gbetagamma. Studies of chimeric and truncated Na(v)1.2 channels identify molecular determinants that affect modulation of I(NaP) located between amino acid residue 1890 and the C terminus at residue 2005. The last 28 amino acid residues of the C terminus are sufficient to support modulation by Gbetagamma when attached to the proximal C-terminal domain. Our results further define the sodium channel subtypes that generate I(NaP) and identify crucial molecular determinants in the C-terminal domain required for modulation by Gbetagamma when attached to the transmembrane body of a responsive sodium channel.


Figures

Figure 1.
Figure 1.
Normalized current traces elicited by a step stimulus to 0 mV from a holding potential of -70 mV from representative tsA-201 cells transfected with rNav1.2a (A) or with hNav1.1 (B). The inset in A (oval) shows the end of the pulse on a 15-fold expanded vertical axis. C, Individual data points (circles) and mean values ± SEM (open squares) of INaP as a percentage of INaT in tsA-201 cells transiently transfected with rNav1.2a (n = 36) or hNav1.1 (n = 20; p < 0.01). The horizontal lines represent the first and 99th percentiles of the range.
Figure 2.
Figure 2.
Changes in INaP produced by Nav1.2 induced by cotransfection of G-protein β and γ subunits. A, B, Current traces from representative tsA-201 cells transfected with rNav1.2a alone (A) or cotransfected with Gβ2 and Gγ3 (B) elicited by a depolarization to 0 mV from a holding potential of -70 mV. C, Individual data points (circles) and mean values ± SEM (open squares) of INaP as a percentage of INaT in tsA-201 cells transfected with rNav1.2a and the indicated plasmids. The whiskers represent the first and 99th percentile values. Mean values were the following, for cells transfected with (from left to right): CD8 receptor as reporter gene (INaP = 4.5 ± 0.7%; n = 36); rNav1.2a, Gβ2, Gγ3, and CD8 receptor (INaP = 11.8 ± 2.3%; n = 18); rNav1.2a with YFP and CFP as reporter genes (INaP = 6.8 ± 1.0%; n = 20); rNav1.2a, Gβ2 expressed in a bicistronic vector with YFP and Gγ3 expressed in a bicistronic vector with CFP (INaP = 16 ± 1.0%; n = 26); rNav1.2a and Gβ2 expressed in a bicistronic vector with YFP (INaP = 17 ± 2%; n = 27); rNav1.2a and Gγ3 expressed in a bicistronic vector together with YFP (INaP = 7 ± 1%; n = 11). Because the CD8 control group and the CFP YFP control group did not differ significantly, they were pooled for additional statistical comparisons (mean of pooled data, INaP = 5.3 ± 0.6%; n = 56).
Figure 3.
Figure 3.
Properties of INaT and INaP in tsA-201 cells transfected with Nav1.2 alone or cotransfected with Gβ2γ3. A, Mean voltage dependence of activation for cells transfected with rNav1.2a alone (open circles) and cells cotransfected with rNav1.2a and Gβ2γ3 (filled squares). The solid lines are the Boltzmann fits that gave the following parameters (see Materials and Methods for definitions): Nav1.2 alone, n = 9, V½ = -5.9 ± 0.2 mV, k = -7.3 ± 0.2 mV; Nav1.2a plus Gβ2γ3, n = 13, V½ = -7.2 ± 0.2 mV, k = -6.6 ± 0.2 mV. B, Currents elicited by slow voltage ramps from a representative cell transfected with rNav1.2a alone (smaller current) or cotransfected with Gβ2γ3 (larger current). C, Voltage dependence of inactivation from representative cells with the mean level of INaP determined with 100 ms prepulses to a variable voltage followed by a test depolarization to 0 mV for Nav1.2a alone (open circles) or cotransfected with Gβ2γ3 (filled squares). Normalized test pulse current is plotted as a function of prepulse potential. Mean parameters derived from fits of Boltzmann functions to the data were: rNav1.2a alone, n = 7, V½ = -44.1 ± 0.2, k = 7.3 ± 0.1, C = 0.023 ± 0.002; rNav1.2a plus Gβ2γ3, n = 13 (fit with the sum of 2 Boltzmann components), V½, 1 = -45.1 ± 0.4, k1 = 8.3 ± 0.4, A2 = 0.35, V½, 2 = -10.0 ± 0.7, k2 = 6.0 ± 0.7, C = 0.117 ± 0.003).
Figure 4.
Figure 4.
INaP conducted by hNav1.1 in two stable cell lines and its modulation by Gβ2γ3. INaP was measured in two cell lines, CL1 and CL2, stably expressing hNav1.1 and in CL2 transiently transfected with G-protein β2 and γ3 subunits. A, Current traces from representative cells during depolarizations to 0 mV from a holding potential of -70 mV from CL2 alone (A) or CL2 cotransfected with Gβ2 and Gγ3 subunits (B). C, INaP as a percentage of INaT in the indicated cells. Values for individual cells are plotted as small symbols; open squares indicate mean ± SEM. Horizontal bars represent the first and 99th percentiles of the range.
Figure 5.
Figure 5.
Properties of transient and persistent current in Nav1.1 alone and cotransfected with Gβ2γ3 as expressed in CL2. A, Mean voltage dependence of activation for CL2 stably expressing hNav1.1 (open circles) and CL2 cells transiently transfected with Gβ2γ3 (filled squares). The solid lines are fits of a Boltzmann equation to the mean data. For CL2 cells expressing Nav1.1 (n = 18), Va = -7.5 ± 0.5 mV and k = -7.3 ± 0.4 mV; for CL2 cells cotransfected with Gβ2γ3 (n = 6), Va = -3.5 ± 0.5 mV and k = -6.4 ± 0.4 mV. B, Currents elicited by slow (70 mV/s) voltage ramps from a representative CL2 cell (smaller current) or a representative CL2 cell cotransfected with Gβ2γ3 (larger current). The ramps shown are from cells with INaP that is somewhat larger than the means of the control and Gβγ-transfected groups to more clearly demonstrate the voltage-dependent properties of INaP. C, Voltage dependence of inactivation from representative cells, selected to have approximately the mean level of INaP, determined with 100 ms prepulses to a variable voltage followed by a test depolarization to 0 mV for CL2 alone (open circles) or CL2 cotransfected with Gβ2γ3 (filled squares). Normalized test pulse current is plotted as a function of prepulse potential. Mean parameters derived from fits of Boltzmann functions to the data were as follows: for CL2, V½ = -37.6 ± 0.1 mV, k = 6.2 ± 0.1 mV, C = 0.029 ± 0.003, n = 11; for CL2 cotransfected with Gβ2γ3, V½ = -34.6 ± 0.2, k = 7.2 ± 0.2, C = 0.063 ± 0.003, n = 4.
Figure 6.
Figure 6.
A, Normalized superimposed current traces from two representative tsA-201 cells transfected with rNav1.4 alone or cotransfected with Gβ2 and Gγ3. Currents were elicited by a depolarization to 0 mV from a holding potential of -70 mV. B, Normalized superimposed current traces from two representative tsA-201 cells transfected with rNav1.5 alone or cotransfected with Gβ2 and Gγ3. Currents were elicited by a depolarization to -10 mV from a holding potential of -70 mV. C, Bar graph showing INaP as percentage of INaT for cells transfected with the indicated sodium channel α subunit alone (black bars) or in combination with Gβ2 and Gγ3 (open bars). For rNav1.2a: control (pooled data), INaP = 5.3 ± 0.6%, n = 56; plus Gβ2γ3, INaP = 16 ± 1.0%, n = 26. For rNav 1.4: control, INaP = 1.9 ± 0.4%, n = 7; plus Gβ2γ3, 2.9 ± 0.6%, n = 8. For rNav1.5: control, 2.6 ± 0.5%, n = 10; plus Gβ2γ3, 3.7 ± 0.7%, n = 5. Error bars represent SEM.
Figure 7.
Figure 7.
INaP in sodium channels containing mutations affecting the QXXER motif and their modulation by G-protein βγ subunits. Bar graph showing INaP as percentage of INaT for cells transfected with the indicated sodium channel α subunit alone (black bars) or in combination with Gβ2 and Gγ3 (open bars). For rNav1.2a, rNav1.4, and rNav1.5, see Figures 2 and 6 for mean values and errors. For Nav1.2a/1.5CT: control, INaP = 1.4 ± 0.3, n = 7; Gβ2γ3, INaP = 21.8 ± 8.1, n = 5. For Nav1.2a/1.4 CT: control, INaP = 8.7 ± 3.2, n = 8; Gβ2γ3, INaP = 12 ± 2, n = 12. For rNav1.2/1.4QxxER: control, INaP = 3.0 ± 0.7, n = 9; Gβ2γ3, INaP = 16 ± 6, n = 5. For rNav1.2a/AAMEAA: control, INaP = 5.9 ± 0.9, n = 10; Gβ2γ3, INaP = 20 ± 3, n = 7. Error bars represent SEM. Asterisks indicate significant modulation by GB2γ3 (p < 0.05).
Figure 8.
Figure 8.
INaP in truncated Nav1.2a channels and its modulation by G-protein β2γ3 subunits. Left, Diagram of the CT of the truncated channel constructs. The rectangle indicates the position of the QXXER motif. Right, Bar graph showing INaP as percentage of INaT for cells transfected with the indicated sodium channel α subunit construct alone (black bars) or in combination with Gβ2 and Gγ3 (open bars). For rNav1.2/K1890: control, INaP = 7.7 ± 0.8%, n = 9; plus Gβ2γ3, INaP = 9 ± 2%, n = 6. For rNav1.2/A1909: control, INaP = 3.6 ± 0.7%, n = 16; plus Gβ2γ3, INaP = 3.5 ± 0.6%, n = 8. For rNav1.2/S1929: control, INaP = 7 ± 1%, n = 8; plus Gβ2γ3, INaP = 9 ± 1%, n = 10. For rNav1.2/T1951: control, INaP = 6 ± 1%, n = 10; plus Gβ2γ3, INaP = 10 ± 2%, n = 9. For rNav1.2/S1977: control, INaP = 6.1 ± 0.9%, n = 21; plus Gβ2γ3, INaP = 10 ± 2%, n = 10. For rNav1.2/K1998: control, INaP = 4 ± 1%, n = 7; plus Gβ2γ3, 9 ± 1%, n = 13. For rNav1.2/1891Δ1977: control, INaP = 2.2 ± 0.3%, n = 14; plus Gβ2γ3, INaP = 14 ± 4%, n = 8. Asterisks indicate significant modulation of a construct by Gβγ (p < 0.05); # indicates modulation by Gβγ that is significantly reduced when compared with modulation of the full-length channel (p < 0.05). Error bars represent SEM.
Figure 9.
Figure 9.
Modulation of rNav1.2a/1891Δ1977 channels by G-protein βγ subunits. A, B, Examples of representative current traces during depolarizations to 0 mV from a holding potential of -70 mV from a cell expressing rNav1.2a/1891Δ1977 channels alone (A) and from a cell coexpressing rNav1.2a/1891Δ1977 and Gβ2γ3 (B). C, D, Currents in response to voltage ramps at 70 mV/s from -60 to +40 mV from the same cells shown in A and B, respectively. E, Mean voltage dependence of activation for cells transfected with rNav1.2a/1891Δ1977 channels alone (open circles) and cotransfected with Gβ2γ3 (filled squares). The solid lines are fits of a Boltzmann equation to the mean data. For rNav1.2a/1891Δ1977: control, V½= -5.6 ± 1.10 mV, k = -8.6 ± 0.47 mV, n = 9; plus Gβ2γ3, V½ = -0.1 ± 1.55 mV and k = -8.5 ± 0.48 mV, n = 7. F, Voltage dependence of inactivation from a representative cell transfected with rNav1.2a/1891Δ1977 channels alone (open circles) and cotransfected with Gβ2γ3 (filled squares). Representative cells were chosen to have approximately the mean level of INaP. Mean parameters derived from fits of Boltzmann functions to the data were for rNav1.2a/1891Δ1977: control, V½= -54.5 ± 0.15 mV, k = 6.3 ± 0.13 mV, C = 0.04 ± 0.002, n = 8; plus Gβ2γ3 (fit with 2 Boltzmann components), V½, 1 = -54.5 ± 0.52 mV, k1 = 4.0 ± 0.80 mV, A2 = 0.43, V½, 2 = -50.8 ± 2.89, k2 = 15.7 ± 2.67 mV, C = 0.03 ± 0.008, n = 3.
Scheme 1
Scheme 1

Similar articles

Cited by

References

    1. Alonso A, Llinas RR (1989) Subthreshold Na+-dependent theta-like rhythmicity in stellate cells of entorhinal cortex layer II. Nature 342: 175-177. - PubMed
    1. Alzheimer C, Schwindt PC, Crill WE (1993) Modal gating of Na+ channels as a mechanism of persistent Na+ current in pyramidal neurons from rat and cat sensorimotor cortex. J Neurosci 13: 660-673. - PMC - PubMed
    1. Azouz R, Alroy G, Yaari Y (1997) Modulation of endogenous firing patterns by osmolarity in rat hippocampal neurones. J Physiol (Lond) 502: 175-187. - PMC - PubMed
    1. Brown AM, Schwindt PC, Crill WE (1994) Different voltage dependence of transient and persistent Na+ currents is compatible with modal-gating hypothesis for sodium channels. J Neurophysiol 71: 2562-2565. - PubMed
    1. Brumberg JC, Nowak LG, McCormick DA (2000) Ionic mechanisms underlying repetitive high-frequency burst firing in supragranular cortical neurons. J Neurosci 20: 4829-4843. - PMC - PubMed

Publication types

MeSH terms

Substances