Comparative Study
. 2005 Mar 30;25(13):3358-68.
doi: 10.1523/JNEUROSCI.4227-04.2005.

Brain-derived neurotrophic factor enhances GABA release probability and nonuniform distribution of N- and P/Q-type channels on release sites of hippocampal inhibitory synapses

Affiliations
Comparative Study

Brain-derived neurotrophic factor enhances GABA release probability and nonuniform distribution of N- and P/Q-type channels on release sites of hippocampal inhibitory synapses

Pietro Baldelli et al. J Neurosci. .

Abstract

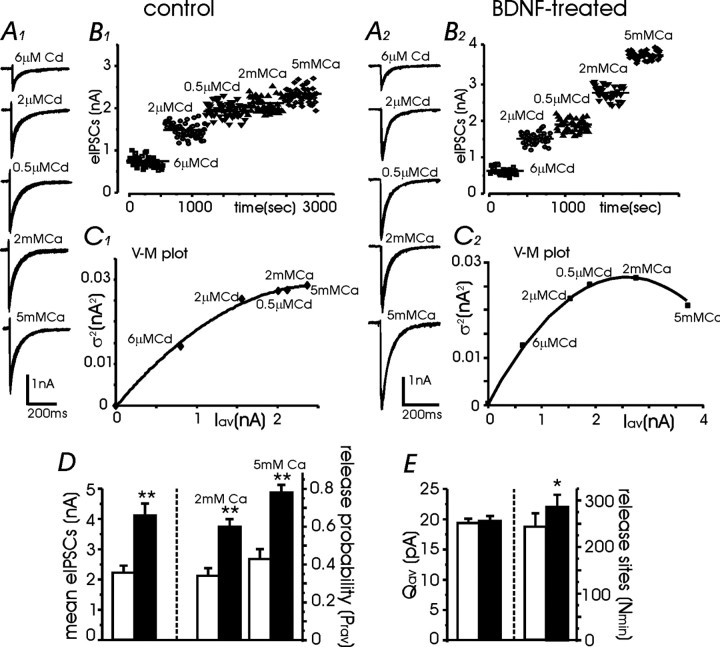
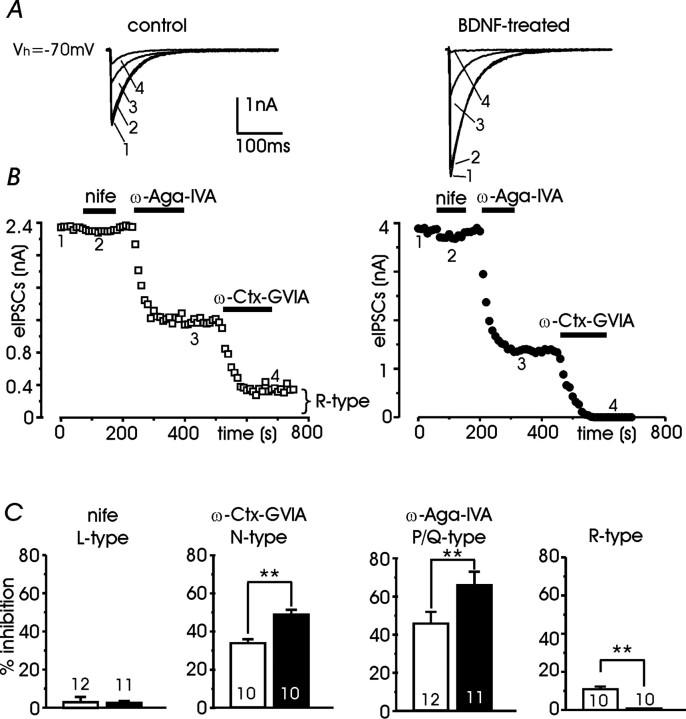
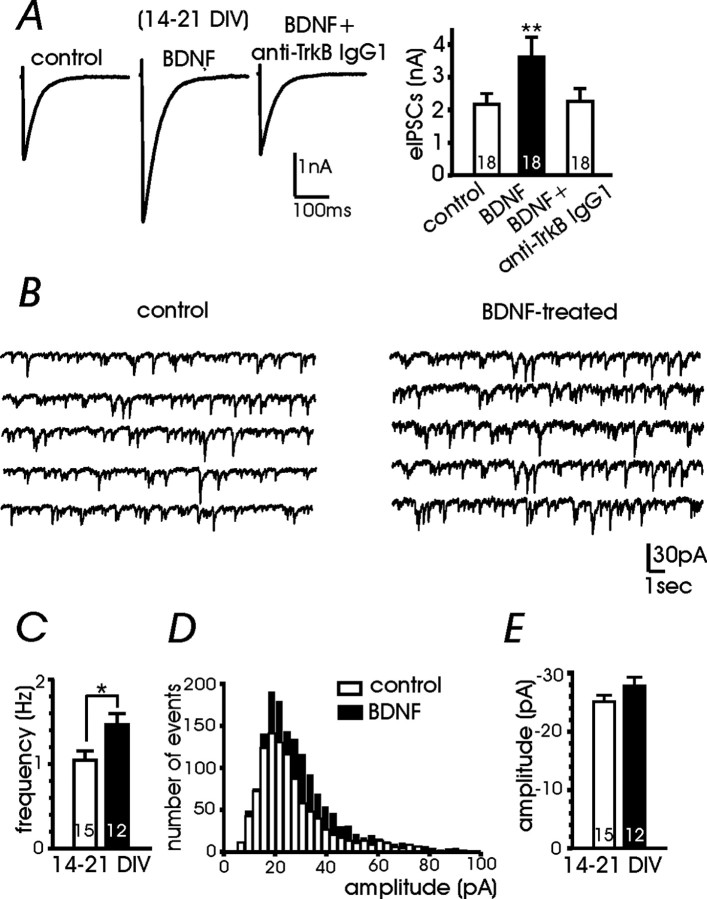
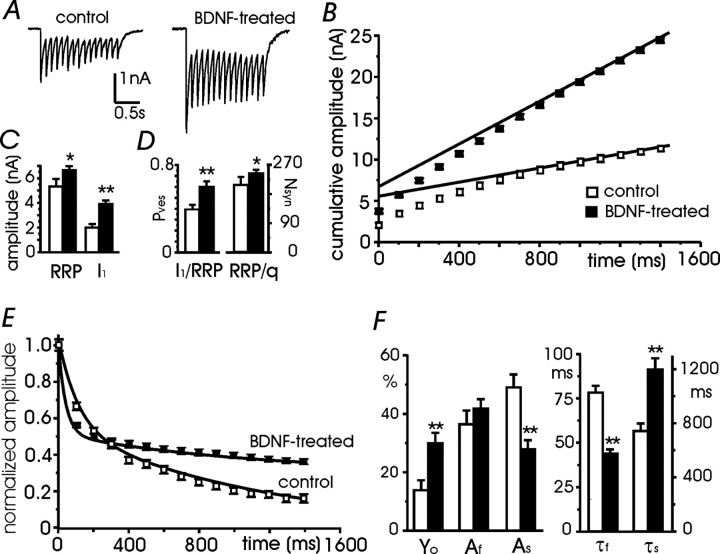
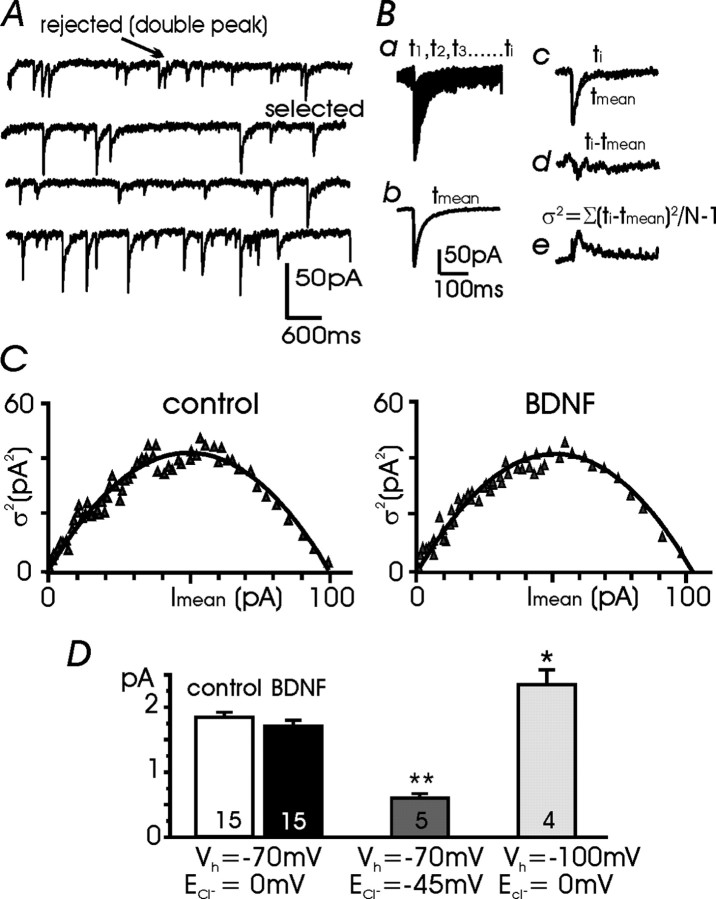
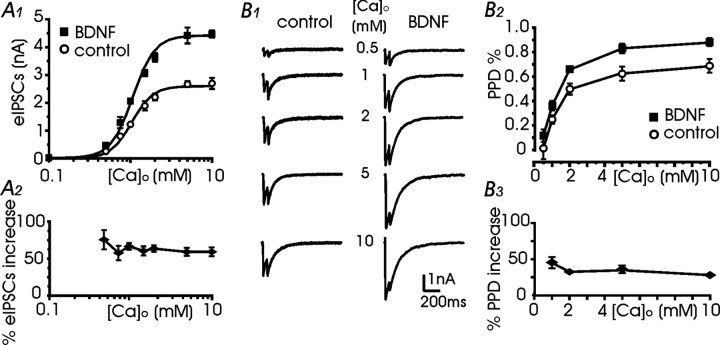
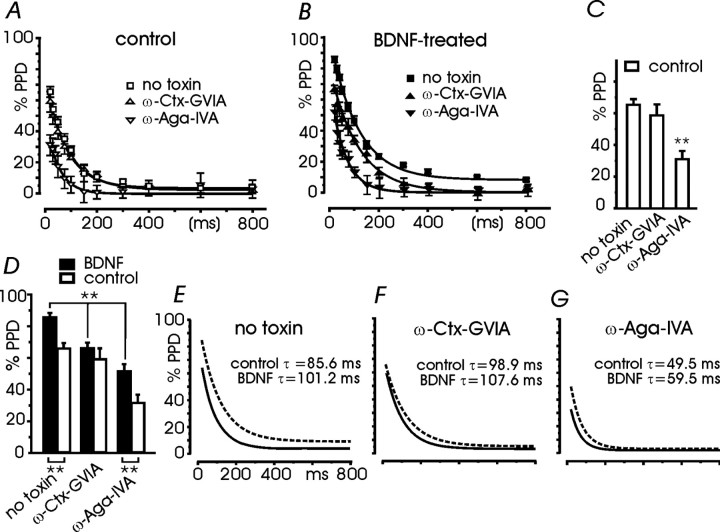
Long-lasting exposures to brain-derived neurotrophic factor (BDNF) accelerate the functional maturation of GABAergic transmission in embryonic hippocampal neurons, but the molecular bases of this phenomenon are still debated. Evidence in favor of a postsynaptic site of action has been accumulated, but most of the data support a presynaptic site effect. A crucial issue is whether the enhancement of evoked IPSCs (eIPSCs) induced by BDNF is attributable to an increase in any of the elementary parameters controlling neurosecretion, namely the probability of release, the number of release sites, the readily releasable pool (RRP), and the quantal size. Here, using peak-scaled variance analysis of miniature IPSCs, multiple probability fluctuation analysis, and cumulative amplitude analysis of action potential-evoked postsynaptic currents, we show that BDNF increases release probability and vesicle replenishment with little or no effect on the quantal size, the number of release sites, the RRP, and the Ca2+ dependence of eIPSCs. BDNF treatment changes markedly the distribution of Ca2+ channels controlling neurotransmitter release. It enhances markedly the contribution of N- and P/Q-type channels, which summed to >100% ("supra-additivity"), and deletes the contribution of R-type channels. BDNF accelerates the switch of presynaptic Ca2+ channel distribution from "segregated" to "nonuniform" distribution. This maturation effect was accompanied by an uncovered increased control of N-type channels on paired-pulse depression, otherwise dominated by P/Q-type channels in untreated neurons. Nevertheless, BDNF preserved the fast recovery from depression associated with N-type channels. These novel presynaptic BDNF actions derive mostly from an enhanced overlapping and better colocalization of N- and P/Q-type channels to vesicle release sites.


Figures

Figure 3.
Figure 3.
Multiprobability variance analysis used to estimate quantal parameters. A1, A2, Superimposed eIPSCs (8 traces for each condition) recorded in two representative control and BDNF-treated neurons at 0.1 Hz. Changing [Ca2+] (2-5 mm) or increasing Cd2+ (0.5, 2, and 6 μm) altered Pr. B1, B2, eIPSC amplitude versus time from the two representative neurons. C1, C2, The variance of the eIPSC amplitude is plotted against the mean for each epoch and fitted with a parabola to estimate Qav and Nmin. D, Mean IPSC and mean Prav in control and BDNF-treated neurons (**p < 0.01 vs controls; n = 8). Prav was calculated at 2 and 5 mm [Ca2+]o. E, Average quantal size (Qav) and number of release sites (Nmin) in control and BDNF-treated neurons (*p < 0.05 vs controls; n = 8). Qav was obtained from the initial slope of the parabola corrected for 1/1 + (CV2i) (see Materials and Methods).
Figure 6.
Figure 6.
Pharmacological dissection of presynaptic Ca2+ channel types supporting eIPSCs. A, Examples of eIPSCs recorded before (1) during sequential application of 3 μm nifedipine (nife) (2), 0.5 μm ω-Aga-IVA (3), and 1 μm ω-Ctx-GVIA (4) in control neurons (left) and treated neurons (right). B, Time course of eIPSC amplitude relative to the same neurons shown in A. C, Mean percentage contribution of Ca2+ channel types to eIPSCs estimated by separately applying the three Ca2+ antagonists on control neurons (open bars) and treated neurons (filled bars); **p < 0.01 vs controls.
Figure 1.
Figure 1.
Effects of BDNF on eIPSC and mIPSC GABAergic currents recorded at the soma of whole-cell-clamped hippocampal neurons. A, Left, eIPSCs recorded from 14-21 DIV neurons under control conditions, with BDNF and BDNF plus anti-TrkB IgG1 (Vh = -70 mV). Right, Mean amplitude of eIPSCs in the conditions and number of neurons indicated; **p < 0.01 versus controls and anti-TrkB IgG1 plus BDNF using one-way ANOVA. B, Consecutive recordings of mIPSCs in 20 DIV control neurons (left) and 20 DIV BDNF-treated neurons (4 d without plus 16 d with BDNF) (right); Vh = -70 mV. C, Mean frequency of mIPSCs calculated from groups of 14-21 DIV control and BDNF-treated neurons. *p < 0.02 versus controls. D, Overlapped amplitude distributions of mIPSCs from the same two neurons in B. BDNF causes a consistent increase in the occurrence of events (filled bars). E, Mean amplitudes of mIPSCs calculated from groups of 14-21 DIV control and BDNF-treated neurons (the number of neurons for each condition is indicated in each bar).
Figure 4.
Figure 4.
Estimate of the RRPsyn and Pves through cumulative amplitude analysis. A, eIPSCs recorded during a train of repetitive stimuli of 10 Hz in a control (left) and a BDNF-treated (right) neuron. B, Cumulative eIPSC amplitude during 10 Hz trains in eight control and eight treated neurons. Data points in the range of 0.8-1.4 s were fitted by linear regression and back-extrapolated to time 0 to estimate the cumulative eIPSC amplitudes before steady-state depression (RRPsyn). C, The mean amplitude of the first eIPSC (I1) is nearly doubled in treated neurons (filled bars; n = 8) versus control neurons (open bars; n = 8) (**p < 0.01 vs controls), whereas the mean RRPsyn is only slightly increased (*p < 0.05 vs controls). D, Mean Pves (**p < 0.01 vs controls) and mean number of vesicles forming the RRPsyn (*p < 0.05 vs controls). E, Plot of eIPSC amplitude versus time during repetitive stimulation fitted with a double-exponential function: I(t) = yo + Af e(-tf) + As e(-ts). F, Mean values of the parameters obtained by the double-exponential fit of E (n = 8; ** p < 0.01 vs controls).
Figure 2.
Figure 2.
PSVA of mIPSCs. A, Consecutive miniature recordings used to select events without double peaks or anomalous noise. B, a, Eighty superimposed mIPSCs, selected as shown in A; b, mean waveform of selected events; c, an mIPSC superimposed to the scaled mean waveform; d, difference between the scaled mean waveform and the individual mIPSC; e, σ2(t) calculated by summing the squares of the difference traces divided by N - 1. C, Relationship between mean current and peak-scaled variance obtained from a representative control and BDNF-treated neuron. D, Mean unitary currents in control neurons and BDNF-treated neurons (n = 15) at Vh = -100 mV (n = 4) and at [Cl-]i = 25 mm (n = 5) (**p < 0.01 and *p < 0.05 vs controls). ECl- indicates the Nernst equilibrium potential for Cl- ions.
Figure 5.
Figure 5.
Ca2+ dependence of GABAergic transmission in control and treated neurons. A1, Mean eIPSC versus [Ca2+]o fitted with a Hill equation: I = Imax [Ca2+]n/([Ca2+]n + KD). BDNF mainly increased the size of eIPSCs (Imax) without altering the slope coefficient (n) and KD (n = 3.3 vs 3.2; KD = 1.03 vs 1.07 mm; Imax = 2.6 vs 4.4 nA) (6 < n < 32). A2, Percentage increase in eIPSCs after BDNF treatment remained constant at different [Ca2+]o levels. Data were obtained from A1. B1, Response to paired-pulse stimulation (50 ms time interval) at increasing [Ca2+]o levels in control and treated neurons. Each trace represents the average of six consecutive recordings (stimulation frequency, 0.066 Hz). B2, Mean PPD versus [Ca2+]o in control and treated neurons (6 < n < 10). B3, Percentage increase in PPD in the presence of BDNF did not change between 2 and 10 mm [Ca2+]o. Data were obtained from B2.
Figure 7.
Figure 7.
Pharmacological dissection of presynaptic Ca2+ channel types supporting PPD and recovery from depression. A, Percentage of PPD vs time in control neurons in the absence of toxins and in the presence of 1 μm ω-Ctx-GVIA and 0.5 μm ω-Aga-IVA. Interevent intervals ranged between 20 and 800 ms. Solid curves are monoexponential fits, with initial amplitude and τrec given in Results (for each point, 9 < n < 16). B, Same as in A but in the presence of BDNF (9 < n < 15). C, Mean percentage of PPD calculated at Δt = 20 ms in control neurons under the indicated condition (**p < 0.01; 9 < n < 16). D, Same as in C but in the presence of BDNF (filled bars; 9 < n < 15). The open bars are taken from C, and statistical comparisons (**p < 0.01) are as indicated. E-G, Monoexponential fit of the percentage of PPD versus time taken from A and B for control neurons (solid lines) and treated neurons (dashed lines) in the absence of toxins (E) and in the presence of ω-Ctx-GVIA (F) and ω-Aga-IVA (G).

Similar articles

Cited by

References

    1. Augustine GJ (2001) How does calcium trigger neurotransmitter release? Curr Opin Neurobiol 11: 320-326. - PubMed
    1. Baldelli P, Forni PE, Carbone E (2000) BDNF, NT-3 and NGF induce distinct new Ca2+ channel synthesis in developing hippocampal neurons. Eur J Neurosci 12: 4017-4032. - PubMed
    1. Baldelli P, Novara M, Carabelli V, Hernández-Guijo JM, Carbone E (2002) BDNF up-regulates evoked GABAergic transmission in developing hippocampal neurons by potentiating presynaptic N- and P/Q-type Ca2+ channel signaling. Eur J Neurosci 16: 2297-2310. - PubMed
    1. Balkowiec A, Katz DM (2000) Activity-dependent release of endogenous brain-derived neurotrophic factor from primary sensory neurons detected by ELISA in situ J Neurosci 20: 7417-7423. - PMC - PubMed
    1. Benfenati F, Valtorta F, Rubenstein JL, Gorelick FS, Greengard P, Czernik AJ (1992) Synaptic vesicle-associated Ca2+/calmodulin-dependent protein kinase II is a binding protein for synapsin I. Nature 359: 417-420. - PubMed

Publication types

MeSH terms

Substances

LinkOut - more resources