Comparative Study
. 2005 Mar 30;25(13):3369-78.
doi: 10.1523/JNEUROSCI.5133-04.2005.

Step-response analysis of chemotaxis in Caenorhabditis elegans

Affiliations
Comparative Study

Step-response analysis of chemotaxis in Caenorhabditis elegans

Adam C Miller et al. J Neurosci. .

Abstract

The sensorimotor transformation underlying Caenorhabditis elegans chemotaxis has been difficult to measure directly under normal assay conditions. Thus, key features of this transformation remain obscure, such as its time course and dependence on stimulus amplitude. Here, we present a comprehensive characterization of the transformation as obtained by inducing stepwise temporal changes in attractant concentration within the substrate as the worm crawls across it. We found that the step response is complex, with multiple phases and a nonlinear dependence on the sign and amplitude of the stimulus. Nevertheless, the step response could be reduced to a simple kinetic model that predicted the results of chemotaxis assays. Analysis of the model showed that chemotaxis results from the combined effects of approach and avoidance responses to concentration increases and decreases, respectively. Surprisingly, ablation of the ASE chemosensory neurons, known to be necessary for chemotaxis in chemical gradient assays, eliminated avoidance responses but left approach responses intact. These results indicate that the transformation can be dissected into components to which identified neurons can be assigned.


Figures

Figure 2.
Figure 2.
The step-response assay. A, Apparatus. A thin (8 μm) porous membrane was suspended over a pair of inverted showerheads. Each showerhead emitted a saline solution with a different NaCl concentration. Stepwise concentration changes were induced within the membrane by sliding the showerhead assembly sideways. B, Ethograms. Each row in the raster plot shows the behavioral record for a single worm before and after a concentration step (ΔC) of +50 mm from a baseline concentration (C0) of 50 mm. The top panel is an expanded view of the bottom panel as indicated by the lines between panels. White regions indicate the forward state, black regions indicate the reversal state, and gray regions indicate the omega state. In both panels, the concentration step occurred at 0 s. C, Behavioral-state probabilities as a function of time for the experiment shown in B. Individual worm ethograms were converted in four separate functions of state probability versus time by computing the fraction of time spent in each state in 10 s bins. Probability data were summarized by computing ensemble averages (across worms) of the probability of each behavioral state as a function of time relative to the concentration step. Arrowheads indicate the time of the concentration step. SEM is shown by the gray bands.
Figure 3.
Figure 3.
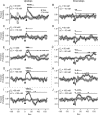
Step-response analysis of the chemotaxis sensorimotor transformation. Each panel shows the time course of average forward-state probability as a function of time for the baseline concentration of NaCl (C0) and concentration step (ΔC) shown in the top left corner. A, Symbols are given in the key. Arrowheads indicate the time of the concentration step. In control experiments (no step), both showerheads emitted the baseline concentration. Excursions in forward probability above its prestimulus baseline are referred to as runs, where as excursions below baseline are referred to as turns. SEM is shown by the gray bands. The dashed line between panels separates statistically significant monophasic responses from statistically significant biphasic responses (asterisks). Data were arcsine-transformed as described in Materials and Methods; this transformation accounts for uneven increments on the ordinates. Statistical significance (step vs no step) was assessed over the periods indicated by the horizontal lines above the traces; results for the short time window (0-60 s) are summarized and extended to other behavioral states in Table 1. Asterisks indicate significant differences (t test; p < 0.05) between the means at each time point after correcting for multiple comparisons; plus symbols indicate significant comparisons detected in uncorrected t tests. Late responses were considered biphasic only if significant in uncorrected t tests. For completeness, the data from Figure 2C are shown again in G. There were at least 30 animals per treatment condition.
Figure 6.
Figure 6.
Neuronal basis of step responses. Each panel shows the time course of average forward-state probability as a function of time for the baseline NaCl concentration (C0) and concentration step (ΔC) shown in the top left corner. Symbols are given in the keys. Arrowheads indicate the time of the concentration step. In control experiments (no step), both showerheads emitted the baseline concentration. SEM is shown by the gray bands or by dashed gray lines. A, Stimulus preexposure. Preexposing worms to 150 mm NaCl specifically eliminated the early phase of the response to upsteps (A1,F(1,58) = 20.2; p < 10-4 and asterisks) and to downsteps (A2, F(1,58) = 12.9; p < 10-3 and asterisks). B, ASE ablation. Removing ASE neurons had no effect on upstep responses (B1, ASE-, step vs sham, step; F(1,67) = 0.16; p > 0.05) but completely eliminated the downstep turn (B2, ASE, step vs sham, step; F(1,64) = 16.0; p < 10-3 and asterisks). In contrast, the downstep run was still present [B2, ASE-, step vsASE-, no step; 0-170 spoststimulus (poststim); F(1,62) = 51.84; p<10-8], as was the upstep run (B1, ASE-, stepvsASE-, no step; 0-60 s poststim; F(1,65) = 28.35; p < 10-5). C, The che-1 mutation. The mutation eliminated the downstep turn (C2, che-1, step vs WT, step; F(1,98) = 12.2; p < 10-3 and asterisks). In contrast, the downstep run was still present (C2, che-1, step vs che-1, no step; 0-170 s poststim; F(1,70) = 21.17; p < 10-4), as was the upstep run (C1, che-1, step vs che-1, no step; 0-60 s poststim; F(1,70) = 7.8; p < 0.01). The mutation did, however, attenuate the upstep run (C1, che-1, step vs WT, step; F(1,58) = 15.0; p < 10-3 and asterisks). Data were arcsine-transformed, as described in Materials and Methods; this transformation accounts for uneven increments on the ordinates. Statistical significance was assessed over the periods indicated by the horizontal lines above the traces. Asterisks indicate significant differences (t test; p < 0.05) between the means at each time point after correcting for multiple comparisons; + symbols indicate significant comparisons detected in uncorrected t tests. There were at least 30 animals per treatment condition.
Figure 4.
Figure 4.
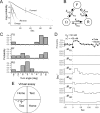
Kinetic model of chemotaxis. A, Log survivor plots for forward, reversal, and omega states. These plots were constructed by computing the dwell-time distribution for each state and displaying on a natural log scale the probability of observing a dwell time more than or equal to to the duration indicated on the abscissa. Many points overlap on this scale; hatch marks indicate the point to the left of which 96% of the data occur. Dwell times ≤2 s were omitted from this analysis because of limitations on observer reaction time. Data were pooled from all of the no-step control experiments in Figure 3. The overall linearity of the data indicates a constant exit rate for each state. B, Behavioral-state diagram with rate constants (k). F, Forward; R, reversal; Ω, omega turn. C, Probability density functions for turn angles associated with the FΩ, RF, and RΩ behavioral-state transitions. These functions were determined empirically by measuring by eye, in video playback, the direction of motion before and after turns. The other three transitions were modeled in idealized form, as described in Materials and Methods. deg, Degrees. D, Forward probability and changes in rate constants. The topmost panel shows a comparison of computed (model) and actual (data) forward probability for a simulated step-response experiment in which the rate-constant time courses were played back through the kinetic model. The model trace represents average forward probability for 500 step responses. The other panels show the rate constants as a function of time relative to the concentration step indicated by the arrowhead. Data are from Figure 3G. E, Diagram of the virtual quadrant assay showing the track of a simulated worm run for the equivalent of 10 min. Home concentration, 50 mm NaCl; test concentration, 100 mm NaCl.
Figure 1.
Figure 1.
Chemotaxis index versus test concentration in the quadrant assay. Approximately 100 worms were placed at the center of the plate (inset) and allowed to move for 10 min. The index was computed as described in Materials and Methods, such that I > 0 reflects a preference for the home concentration of NaCl (50 mm), whereas I < 0 reflects a preference for the test concentration. Each point represents the mean value of at least 16 assay plates. The line is a linear fit to the data for test concentrations from 0 to 100 mm. Letters a-f correspond to rows in Table 1. Overall, worms moved so as to maximize the ambient NaCl concentration. This effect was weaker than expected at a test concentration of 150 mm. Inset, Diagram of the quadrant assay.
Figure 5.
Figure 5.
Average chemotaxis index versus test concentration in simulated quadrant assays. Data points for simulated assays represent the mean of three assays of 2000 worms each; SE was typically less than or equal to symbol height. Symbols are given in each key. A, Wild-type model versus data from the real quadrant assays. There are no model data points at test concentrations of 20 and 80 mm, because step responses were not recorded at these concentrations. Wild-type data are the same as those in Figure 1. B, Wild-type model versus virtual mutants in which either the response to upsteps or the response to downsteps was deleted in the simulations. Values for the wild-type model are the same as in A. C, Wild-type model versus virtual mutants in which the late component of the downstep response was deleted. The virtual mutants were studied only at the three test concentrations for which the turn-and-run sequence was observed (Fig. 3F, H, J).

Similar articles

Cited by

References

    1. Bargmann CI, Avery L (1995) Laser killing of cells in Caenorhabditis elegans In: Methods in cell biology (Epstein HF, Shakes DC, eds), pp 225-250. San Diego: Academic. - PMC - PubMed
    1. Bargmann CI, Horvitz HR (1991) Chemosensory neurons with overlapping functions direct chemotaxis to multiple chemicals in C. elegans Neuron 7: 729-742. - PubMed
    1. Bialek W, Rieke F, de Ruyter van Steveninck RR, Warland D (1991) Reading a neural code. Science 252: 1854-1857. - PubMed
    1. Block SM, Segall JE, Berg HC (1982) Impulse responses in bacterial chemotaxis. Cell 31: 215-226. - PubMed
    1. Brenner S (1974) The genetics of Caenorhabditis elegans Genetics 77: 71-94. - PMC - PubMed

Publication types

MeSH terms

LinkOut - more resources