Comparative Study
. 2005 Mar 30;25(13):3379-88.
doi: 10.1523/JNEUROSCI.3553-04.2005.

A GIT1/PIX/Rac/PAK signaling module regulates spine morphogenesis and synapse formation through MLC

Affiliations
Comparative Study

A GIT1/PIX/Rac/PAK signaling module regulates spine morphogenesis and synapse formation through MLC

Huaye Zhang et al. J Neurosci. .

Abstract

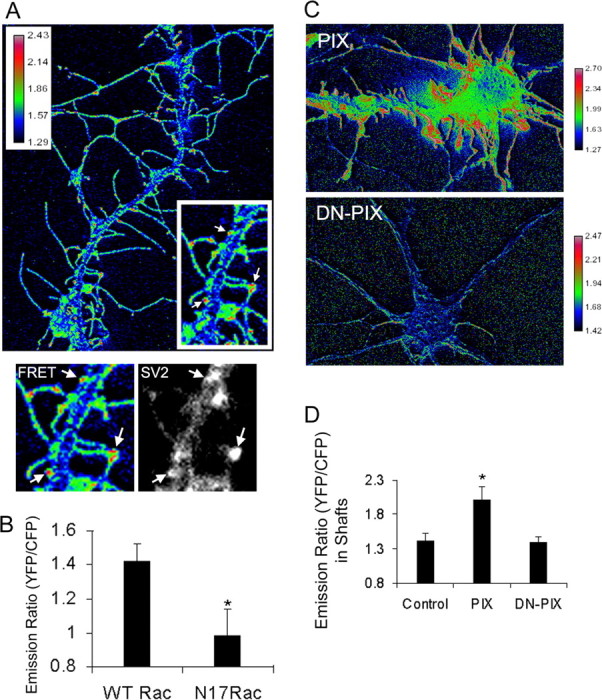
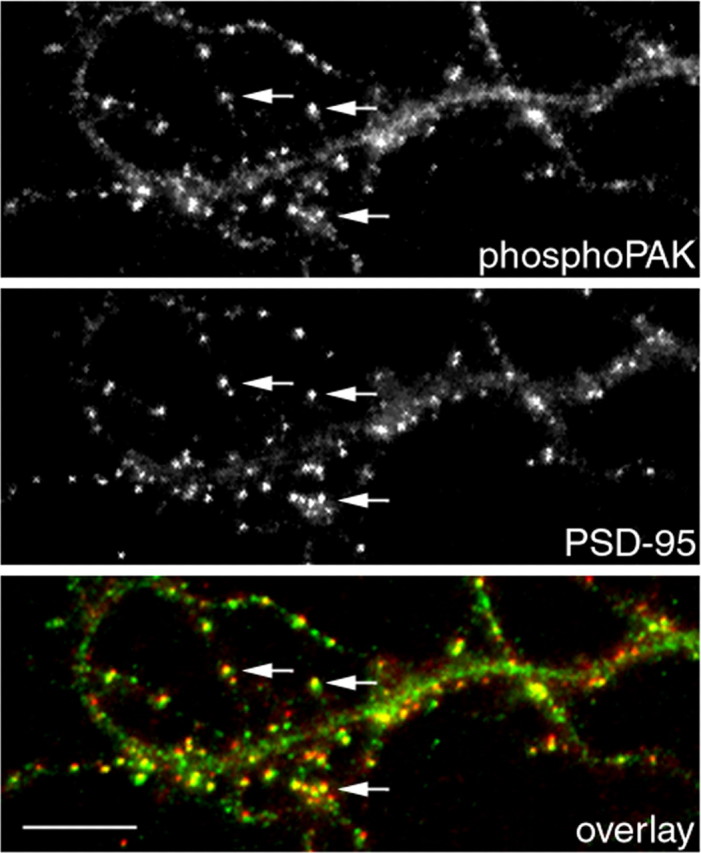
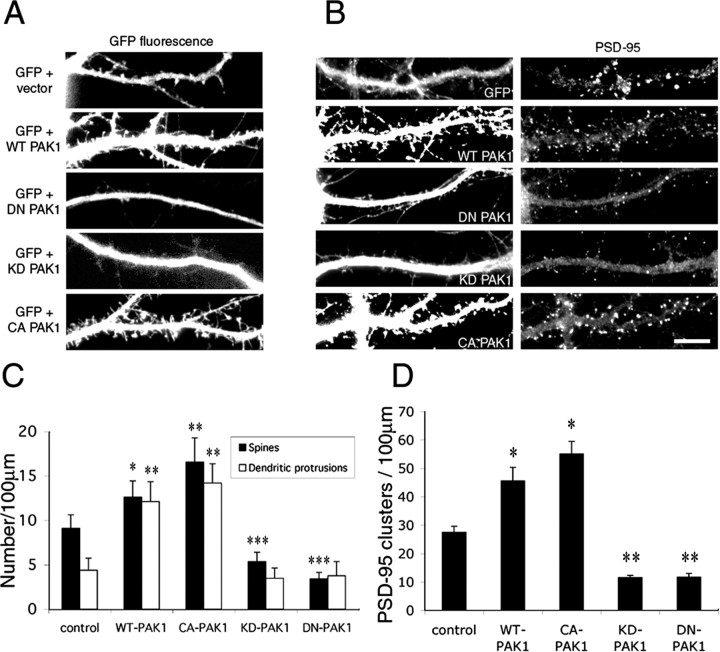
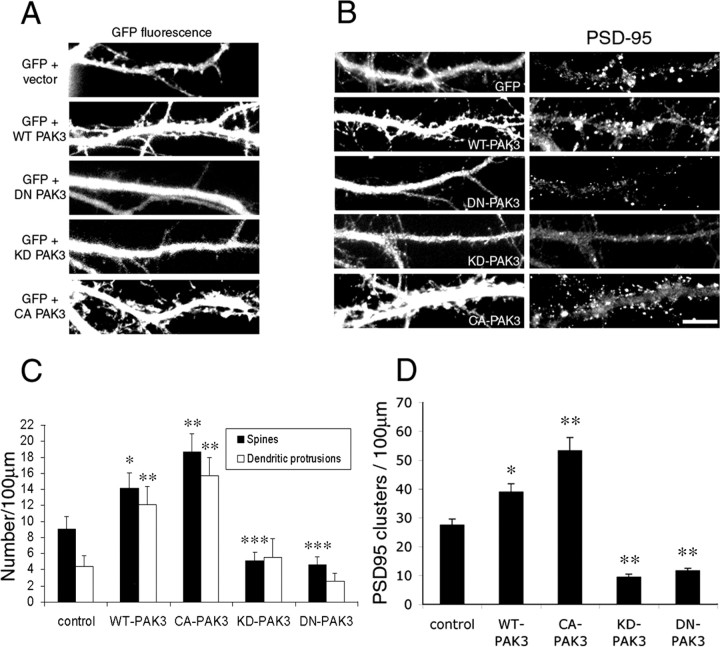
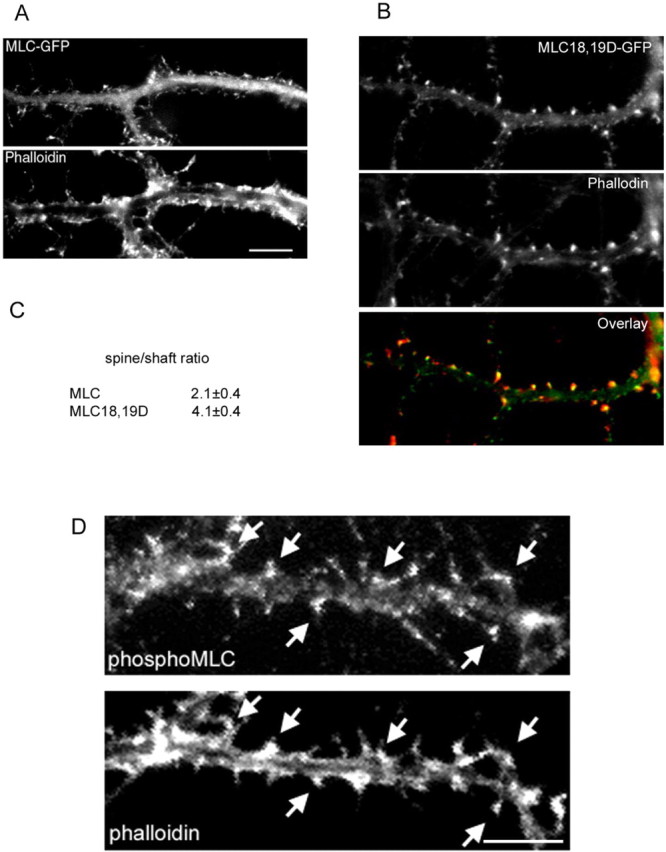
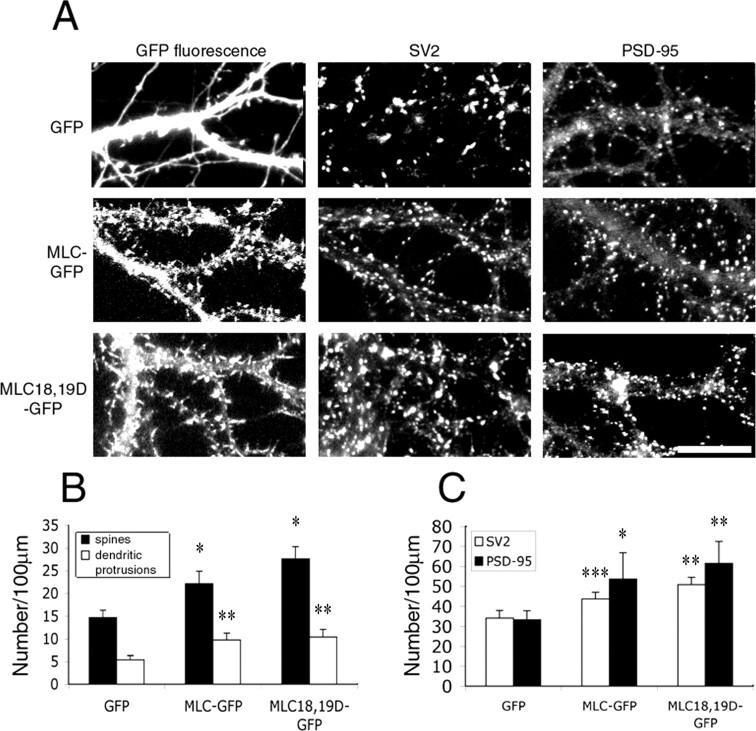
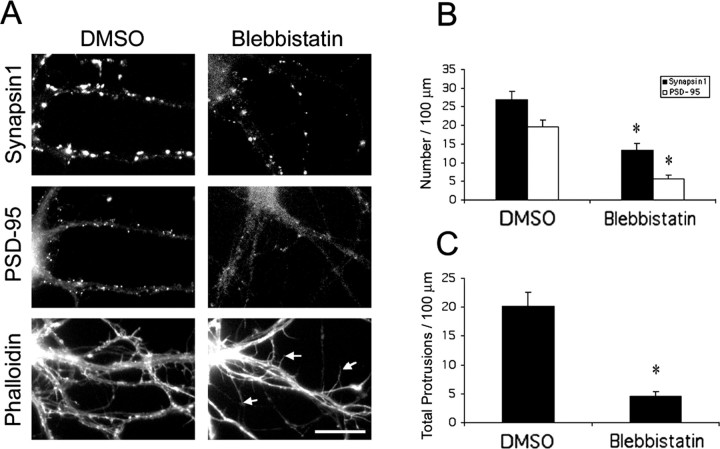
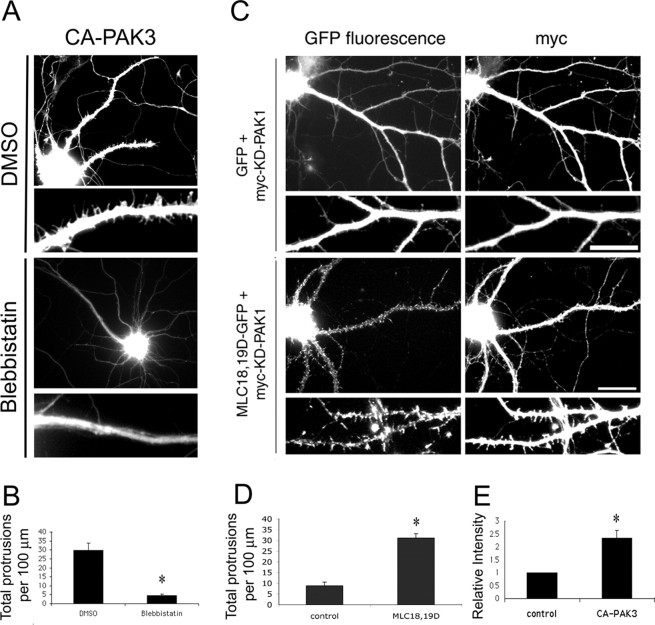
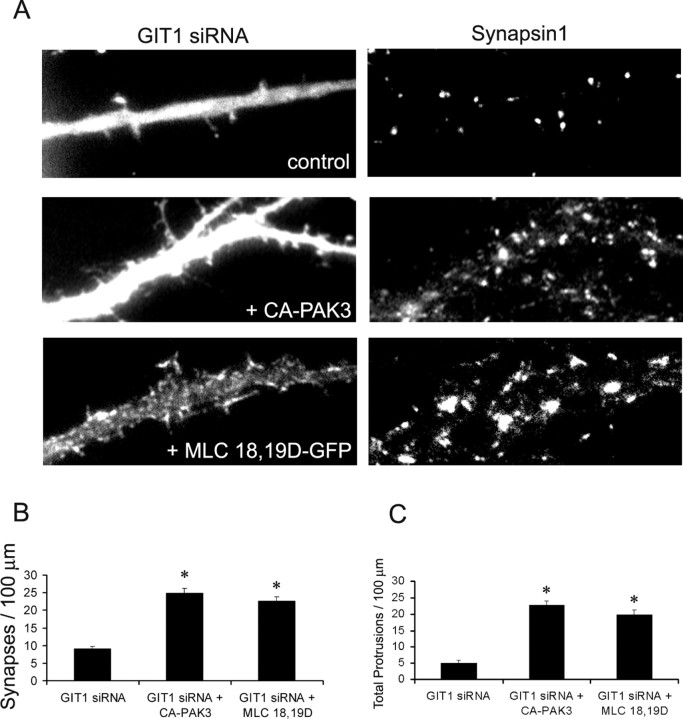
Three of seven recently identified genes mutated in nonsyndromic mental retardation are involved in Rho family signaling. Two of the gene products, alpha-p-21-activated kinase (PAK) interacting exchange factor (alphaPIX) and PAK3, form a complex with the synaptic adaptor protein G-protein-coupled receptor kinase-interacting protein 1 (GIT1). Using an RNA interference approach, we show that GIT1 is critical for spine and synapse formation. We also show that Rac is locally activated in dendritic spines using fluorescence resonance energy transfer. This local activation of Rac is regulated by PIX, a Rac guanine nucleotide exchange factor. PAK1 and PAK3 serve as downstream effectors of Rac in regulating spine and synapse formation. Active PAK promotes the formation of spines and dendritic protrusions, which correlates with an increase in the number of excitatory synapses. These effects are dependent on the kinase activity of PAK, and PAK functions through phosphorylating myosin II regulatory light chain (MLC). Activated MLC causes an increase in dendritic spine and synapse formation, whereas inhibiting myosin ATPase activity results in decreased spine and synapse formation. Finally, both activated PAK and activated MLC can rescue the defects of GIT1 knockdown, suggesting that PAK and MLC are downstream of GIT1 in regulating spine and synapse formation. Our results point to a signaling complex, consisting of GIT1, PIX, Rac, and PAK, that plays an essential role in the regulation of dendritic spine and synapse formation and provides a potential mechanism by which alphaPIX and PAK3 mutations affect cognitive functions in mental retardation.


Figures

Figure 1.
Figure 1.
Knockdown of GIT1 expression affects spine and synapse formation. A, Hippocampal neurons were cotransfected with GFP and either pSUPER vector alone or GIT1 siRNA at 6 d in culture and were fixed and immunostained for endogenous GIT1 at 12 d. GIT1 siRNA, but not pSUPER alone, caused a dramatic decrease in endogenous GIT1 expression. The neurons expressing the siRNA constructs were >95% viable as determined by trypan blue staining. B, Quantification of fluorescent intensity of GIT1 immunostaining in GIT1 siRNA transfected neurons as assayed by the mean fluorescent intensity in the soma. Fluorescent intensity of nearby untransfected neurons was measured, and these neurons served as controls. Values are normalized to control neurons. C, Expression of GIT1 siRNA in hippocampal neurons causes a decrease in spine and synaptic density. These defects are rescued by coexpressing GFP-tagged human GIT1. Scale bar, 10 μm. D, Quantification of the effects of GIT1 siRNA on the number of dendritic spines and protrusions. The effects are rescued by coexpressing human GIT1 (rescue). Asterisks indicate p < 0.0001. E, Quantification of the effects of GIT1 siRNA on synaptic density. The effects are rescued by coexpressing human GIT1 (rescue). For each condition, 85-95 dendrites of 18-20 neurons from three different cultures were analyzed. *p < 0.0001. Error bars represent SEM from three experiments.
Figure 2.
Figure 2.
Localized activation of Rac visualized by FRET. A, Hippocampal neurons were transfected with Raichu-WT Rac at 8 d in culture and imaged at 10 d in culture. The ratio image of YFP and CFP was used to represent FRET efficiency. Note the low FRET efficiency in the dendritic shaft. Arrows point to active Rac localization in dendritic spines. These spines are in contact with presynaptic terminals as determined by SV2 coimmunostaining (bottom panels). B, Raichu-WT Rac and Raichu-N17Rac were transfected into hippocampal neurons, and FRET analyses were performed. Emission ratios are shown in the bar graph. *p < 0.001. C, HA-tagged PIX or DN-PIX (L238R, L239S; GEF deficient) were cotransfected with Raichu-WT Rac into the hippocampal neurons. FRET analyses were performed, and ratio images of YFP and CFP are shown to represent FRET efficiency. Ectopic expression of PIX results in high-FRET efficiency throughout the dendritic protrusions and increased FRET efficiency in the dendritic shafts. Expression of DN-PIX results in an overall reduction in FRET efficiency. D, Quantification of the emission ratios in the dendritic shafts of the neurons transfected with the PIX mutants. Note that in the dendritic shafts, the FRET efficiency is not significantly different between DN-PIX-expressing neurons and control neurons, indicating that under basal conditions, Rac is activated locally in dendritic spines. *p < 0.001. Error bars represent SEM from three experiments.
Figure 3.
Figure 3.
Active PAK localizes to synapses. Hippocampal neurons were fixed and double stained for phospho-PAK and PSD-95 at 14 d in culture. Phospho-PAK accumulates in clusters colocalizing with PSD-95 clusters (arrows). Scale bar, 10 μm.
Figure 4.
Figure 4.
PAK1 regulates dendritic spine and synapse formation. Different PAK1 constructs were transfected into hippocampal neurons at 7 d in culture and were fixed and immunostained at 14 d in culture. GFP was cotransfected with the PAK1 constructs to visualize the spines. Control neurons were cotransfected with GFP and an empty vector. Ectopic expression of WT-PAK1 or CA-PAK1 promotes the formation of dendritic spines and protrusions (A) as well as the formation of excitatory synapses as visualized by PSD-95 immunostaining (B). Expression of either DN-PAK1 or KD-PAK1 inhibits the formation of dendritic spines and excitatory synapses (A, B). C, Quantification of dendritic spines and protrusions in neurons transfected with the PAK1 constructs. *p < 0.001; **, ***p < 0.0005. D, Quantification of PSD-95 clusters in neurons transfected with the PAK1 constructs. *p < 0.001; **p < 0.0002. Scale bar, 10 μm. For each construct, 90-100 dendrites of 15-20 neurons from three independent cultures were analyzed. Error bars represent SEM from three experiments.
Figure 5.
Figure 5.
PAK3 regulates dendritic spine and synapse formation. Different PAK3 constructs were transfected into hippocampal neurons at 7 d in culture and were fixed and immunostained at 14 d in culture. GFP was cotransfected with the PAK3 constructs to visualize the spines. Control neurons were cotransfected with GFP and an empty vector. Ectopic expression of WT-PAK3 or CA-PAK3 promotes the formation of dendritic spines and protrusions (A) as well as the formation of excitatory synapses as visualized by PSD-95 immunostaining (B). Expression of either DN-PAK3 or KD-PAK3 inhibits the formation of dendritic spines and excitatory synapses (A, B). Scale bar, 10 μm. C, Quantification of dendritic spines and protrusions in neurons transfected with the PAK3 constructs. *p < 0.001; **, ***p < 0.0005. D, Quantification of PSD-95 clusters in neurons transfected with the PAK3 constructs. *p < 0.001; **p < 0.0001. For each construct, 85-100 dendrites of 17-20 neurons from three independent cultures were analyzed. Error bars represent SEM from three experiments.
Figure 6.
Figure 6.
Active MLC localizes to dendritic spines. Hippocampal neurons were transfected with either GFP-tagged wild-type MLC (MLC-GFP) or GFP-tagged active MLC (MLC18,19D-GFP) at 7 d and were fixed and immunostained for rhodamine-phalloidin at 14 d in culture. A, MLC-GFP shows partial localization to spines. Scale bar, 10 μm. B, MLC18,19D-GFP localizes primarily to spines as determined by coimmunostaining with rhodamine-phalloidin. To quantify the localization of the MLC constructs, an average spine/shaft fluorescent intensity ratio was generated for each construct (C). MLC18,19D-GFP showed significantly higher accumulation in spines compared with MLC-GFP. D, Hippocampal neurons were coimmunostained for endogenous phosphoserine 19 MLC and rhodamine-phalloidin. Phospho-MLC localizes to dendritic spines (arrows). Scale bar, 10 μm.
Figure 7.
Figure 7.
Ectopic expression of MLC promotes spine and synapse formation. Hippocampal neurons were transfected with GFP, MLC-GFP, or MLC18,19D-GFP at 7 d in culture and were fixed and immunostained for synaptic markers at 14 d in culture. A, Expression of MLC or MLC-18,19D increases the number of dendritic spines and protrusions as well as SV2 and PSD-95 clusters. Scale bar, 20 μm. B, Quantification of dendritic spines and protrusions. *, **p < 0.001. C, Quantification of the number of SV2 clusters and PSD-95 clusters. A total of 95-100 dendrites of 20 neurons from three different cultures were analyzed for each construct. The differences between MLC constructs and GFP-expressing neurons are statistically significant (*p < 0.002; **p < 0.0001; ***p < 0.0005). Error bars represent SEM from three experiments.
Figure 8.
Figure 8.
Blebbistatin inhibits dendritic spine and synapse formation. A, Hippocampal neurons were treated with 50 μm blebbistatin at 7 d in culture and were fixed and immunostained for various synaptic markers at 9 d in culture. Control cultures were treated with DMSO. Arrows point to the abnormally long, thin, dendritic protrusions. Scale bar, 20 μm. B, Quantification of the number of synapses as visualized by both synapsin1 and PSD-95. *p < 0.0001. C, Quantification of the number of total protrusions, including dendritic spines and dendritic protrusions. *p < 0.0001. A total of 85-95 dendrites of 15-20 neurons from four independent cultures were analyzed for each condition. Error bars represent SEM from three experiments.
Figure 9.
Figure 9.
MLC functions downstream of PAK. A, Hippocampal neurons were cotransfected with GFP and CA-PAK3 at 6 d in culture and treated with either DMSO or 50 μm blebbistatin at 7 d in culture. After 48 h, neurons were fixed and immunostained for the myc epitope. Treatment of neurons with blebbistatin completely inhibited the protrusions induced by CA-PAK3. B, Quantification of the total number of protrusions, including dendritic spines and dendritic protrusions. *p < 0.0001. For each condition, 90-95 dendrites of 15-18 neurons from three independent cultures were analyzed. C, KD-PAK1 was cotransfected with either GFP or MLC18,19D-GFP at 7 d in culture and was fixed at 14 d in culture. Expression of KD-PAK1 was confirmed by immunostaining for the myc epitope. Coexpression of MLC18,19D-GFP rescues the defects in spine formation in KD-PAK1. Scale bars: top panels of each construct, 20 μm; enlarged pictures in the bottom panels, 10 μm. D, Quantification of the total number of protrusions in neurons expressing KD-PAK1 and GFP (control) or KD-PAK1 and MLC18,19D-GFP (MLC18,19D). The total number of protrusions includes dendritic spines and dendritic protrusions. *p < 0.0001. A total of 90-95 dendrites of 16-18 neurons from three different cultures were analyzed for each condition. E, Quantification of the relative fluorescent intensity of phospho-MLC in control neurons versus CA-PAK3-transfected neurons. Fluorescent intensity was normalized to the level of control neurons. *p < 0.0005. Error bars represent SEM from three experiments.
Figure 10.
Figure 10.
PAK and MLC function downstream of GIT1. A, Hippocampal neurons were transfected with pSUPER-GIT1 siRNA along with GFP (control), CA-PAK3, or activated MLC (MLC18,19D-GFP) at 6 d in culture and were fixed and immunostained for synapsin1 at 12 d in culture. Both CA-PAK3 and MLC 18,19D-GFP were able to rescue the GIT1 siRNA-induced defects. B, Quantification of the number of synapses in neurons transfected with the indicated constructs. *p < 0.001. C, Quantification of the total number of protrusions, including dendritic spines and protrusions not associated with presynaptic terminals. For each condition, 85-95 dendrites of 15-20 neurons from independent cultures were analyzed. *p < 0.001. Error bars in represent SEM from three experiments.

References

    1. Allen KM, Gleeson JG, Bagrodia S, Partington MW, MacMillan JC, Cerione RA, Mulley JC, Walsh CA (1998) PAK3 mutation in nonsyndromic X-linked mental retardation. Nat Genet 20: 25-30. - PubMed
    1. Bienvenu T, des Portes V, McDonell N, Carrie A, Zemni R, Couvert P, Ropers HH, Moraine C, van Bokhoven H, Fryns JP, Allen K, Walsh CA, Boue J, Kahn A, Chelly J, Beldjord C (2000) Missense mutation in PAK3, R67C, causes X-linked nonspecific mental retardation. Am J Med Genet 93: 294-298. - PubMed
    1. Boda B, Alberi S, Nikonenko I, Node-Langlois R, Jourdain P, Moosmayer M, Parisi-Jourdain L, Muller D (2004) The mental retardation protein PAK3 contributes to synapse formation and plasticity in hippocampus. J Neurosci 24: 10816-10825. - PMC - PubMed
    1. Chew TL, Masaracchia RA, Goeckeler ZM, Wysolmerski RB (1998) Phosphorylation of non-muscle myosin II regulatory light chain by p21-activated kinase (gamma-PAK). J Muscle Res Cell Motil 19: 839-854. - PubMed
    1. Dunaevsky A, Tashiro A, Majewska A, Mason C, Yuste R (1999) Developmental regulation of spine motility in the mammalian central nervous system. Proc Natl Acad Sci USA 96: 13438-13443. - PMC - PubMed

Publication types

MeSH terms

Substances