Comparative Study
. 2005 Mar 30;25(13):3400-13.
doi: 10.1523/JNEUROSCI.3231-04.2005.

Relationship between membrane phosphatidylinositol-4,5-bisphosphate and receptor-mediated inhibition of native neuronal M channels

Affiliations
Comparative Study

Relationship between membrane phosphatidylinositol-4,5-bisphosphate and receptor-mediated inhibition of native neuronal M channels

Joanna S Winks et al. J Neurosci. .

Abstract

The relationship between receptor-induced membrane phosphatidylinositol-4'5'-bisphosphate (PIP2) hydrolysis and M-current inhibition was assessed in single-dissociated rat sympathetic neurons by simultaneous or parallel recording of membrane current and membrane-to-cytosol translocation of the fluorescent PIP2/inositol 1,4,5-trisphosphate (IP3)-binding peptide green fluorescent protein-tagged pleckstrin homology domain of phospholipase C (GFP-PLCdelta-PH). The muscarinic receptor agonist oxotremorine-M produced parallel time- and concentration-dependent M-current inhibition and GFP-PLCdelta-PH translocation; bradykinin also produced parallel time-dependent inhibition and translocation. Phosphatidylinositol-4-phosphate-5-kinase (PI5-K) overexpression reduced both M-current inhibition and GFP-PLCdelta-PH translocation by both oxotremorine-M and bradykinin. These effects were partly reversed by wortmannin, which inhibits phosphatidylinositol-4-kinase (PI4-K). PI5-K overexpression also reduced the inhibitory action of oxotremorine-M on PIP2-gated G-protein-gated inward rectifier (Kir3.1/3.2) channels; bradykinin did not inhibit these channels. Overexpression of neuronal calcium sensor-1 protein (NCS-1), which increases PI4-K activity, did not affect responses to oxotremorine-M but reduced both fluorescence translocation and M-current inhibition by bradykinin. Using an intracellular IP3 membrane fluorescence-displacement assay, initial mean concentrations of membrane [PIP2] were estimated at 261 microm (95% confidence limit; 192-381 microm), rising to 693 microm (417-1153 microm) in neurons overexpressing PI5-K. Changes in membrane [PIP2] during application of oxotremorine-M were calculated from fluorescence data. The results, taken in conjunction with previous data for KCNQ2/3 (Kv7.2/Kv7.3) channel gating by PIP2 (Zhang et al., 2003), accorded with the hypothesis that the inhibitory action of oxotremorine-M on M current resulted from depletion of PIP2. The effects of bradykinin require additional components of action, which might involve IP3-induced Ca2+ release and consequent M-channel inhibition (as proposed previously) and stimulation of PIP2 synthesis by Ca2+-dependent activation of NCS-1.


Figures

Figure 8.
Figure 8.
A, Determination of the free cytosolic volume. Graphs show the mean fluorescence intensity (ordinates) after the dispersion of different concentrations of a fluorescent low-molecular-weight compound (BODIPY-FL) in aqueous vesicles (squares) and mean cytosolic intensity of sympathetic neurons whole-cell patched with electrodes containing the same fluorescent compound (triangles) (see Materials and Methods). Mean slopes (fluorescence intensity per micromolar concentration [BODIPY]) ± SEM were as follows: aqueous vesicles, 26 ± 0.9; intracellular, 6.6 ± 0.66. The ratio of the slopes provides a measure of the free cytosolic space available to BODIPY, from which cytosolic concentration of IP3 generated by PIP2 hydrolysis could be estimated (see Results). B, Changes in distribution of GFP-PLCδ-PH between membrane and cytosol with progressive hydrolysis of PIP2, calculated from Equations 3-7, for a sympathetic neuron with a diameter of 20 μm, an initial membrane PIP2 concentration of 261 μm, an effective CMVR of 83, and binding constants of 0.1 and 2 μm for IP3 and PIP2, respectively (Table 1). The dashed line shows how the fractional M-channel availability would be expected to change during PIP2 hydrolysis, as calculated from the data in the study by Zhang et al. (2003).
Figure 1.
Figure 1.
Agonist-induced translocation of GFP-PLCδ-PH. A, Scanning confocal microscope images (8-bit resolution; i.e., 256 gray scales) of GFP-PLCδ-PH fluorescence distribution in a sympathetic neuron before and during application of 10 μm Oxo-M. B, Plot of fluorescence intensity across a single line scan (A, white line) before and during the peak of the Oxo-M response. C, Continuous time plot of cytosolic fluorescence intensity recorded in a single region of interest (A, white box). D, Changes in CFI (12-bit resolution; i.e., 4096 gray scales) in a single neuron produced by successive applications of 10 μm Oxo-M and 100 nm BK. E, Mean changes in cytosolic fluorescence in seven neurons produced by 10 μm Oxo-M and 100 nm BK applied sequentially as in D. The change in fluorescence is given as ΔF/F0 × 100%, where ΔF = F - F0, F is peak fluorescence after agonist application, and F0 is baseline fluorescence before agonist application.
Figure 2.
Figure 2.
Simultaneous recording of changes in cytosolic fluorescence (A), membrane current (B), and M-current amplitude (C) produced by oxotremorine-M in a sympathetic neuron. Membrane current was recorded using an amphotericin perforated-patch electrode from a neuron expressing GFP-PLCδ-PH. Cytosolic fluorescence was monitored simultaneously from a defined cytoplasmic region of interest as in Figure 1. Oxo-M (10 μm) was added to the bathing fluid for 60 s, indicated by the open bar and vertical dashed lines in A-C. A, Percentage change in cytosolic fluorescence from baseline (ΔF/F0 × 100%). B, Membrane current (in picoamperes) recorded at -20 mV. Downward deflections show current transients in response to hyperpolarizing steps to -50 mV. Currents recorded at times a-c are shown on a faster time base above. C, Amplitude of M-current deactivation tails (in picoamperes) measured from the initial amplitudes of the deactivation currents illustrated in B plotted against time. Note that oxotremorine-M produced a large increase in fluorescence coincident with the reduction of outward current and M-current deactivation tails.
Figure 3.
Figure 3.
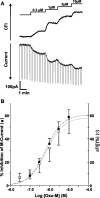
Concentration dependence of oxotremorine-M-induced increases in cytosolic fluorescence and M-current inhibition. A, Simultaneous recording of CFI (arbitrary units) and membrane current (in picoamperes) during step-wise increments in the concentration of oxotremorine-M added to the bath-perfusion fluid. B, Mean concentration-response curves for percentage of inhibition of M current (filled squares and dashed line) and percentage increase in cytosolic fluorescence (ΔF/F0 × 100%; open circles and dotted line) produced by increasing concentrations of oxotremorine-M (in log-molar units). Oxotremorine-M was added cumulatively as in A. Each point is the mean from measurements in 5-13 neurons; bars show unidirectional SEMs. Curves are drawn according to the equation y = ymax × x/(x + K). Values for ymax and K were (mean ± SEM) as follows: M-current inhibition, 61.0 ± 2.4%, 0.68 ± 0.13 μm; fluorescence, 58.2 ± 3.3%, 0.68 ± 0.94 μm.
Figure 4.
Figure 4.
Overexpression of PI5-K reduces M-current inhibition and GFP-PLCδ-PH translocation induced by both oxotremorine-M and bradykinin and is partly reversed by inhibiting phosphatidylinositol-4-kinase with wortmannin. A, Sympathetic neuron expressing both a red-tagged (pDSRED) PI5-K (i) and GFP-PLCδ-PH (ii, iii). Aiii shows a deconvolved image of that in ii (see Materials and Methods). B, Mean inhibition of the M current (%) in control (Con), PI5-K, and mutant (Mut) PI5-K overexpressing neurons by 10 μm oxotremorine-M and 100 nm bradykinin. The mutant PI5-K was devoid of kinase activity. M-current amplitudes were measured from deactivation tail currents. C, Mean rise in cytosolic fluorescence intensity (ΔF/F0; %) in GFP-PLCδ-PH-expressing cells produced by 10 μm oxotremorine-M or 100 nm bradykinin in control and PI5-K overexpressing cells. D, Mean percentage M-current inhibition in control (noninjected) and PI5-K overexpressing neurons in the absence or presence of 15 μm wortmannin (added 10-15 min before agonist). Error bars indicate SEM of the number of cells indicated.
Figure 5.
Figure 5.
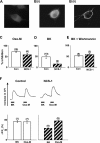
The effects of NCS-1 overexpression in sympathetic neurons. A, B, Immunocytochemistry of NCS-1 antibody staining in a noninjected neuron (A) and a neuron preinjected intranuclearly (B) 1 d previously with NCS-1 cDNA. NCS-1 is endogenously expressed, but staining is enhanced in the NCS-1 cDNA-injected neuron. Bii is a deconvolved image of that in Bi, showing that most of the staining is associated with the plasma membrane. C, D, Overexpression of NCS-1 reduces M-current inhibition by 100 nm BK (D) but not that produced by 10 μm Oxo-M (C). E, Addition of 20 μm wortmannin (15 min before) reversed the effect of NCS-1 on BK-induced inhibition. Bars show percentage inhibition of M-current measured from deactivation tails. F, NCS-1 reduces bradykinin-induced translocation of GFP-PLCδ-PH. Upper records show representative traces of increases in CFI (arbitrary units) in a noninjected neuron (control) and an NCS-1-expressing neuron produced sequentially by BK (100 nm) and Oxo-M (10 μm). Lower bar charts show mean values of percentage ΔF/F0 produced by 100 nm BK and 10 μm Oxo-M in control and NCS-1 overexpressing neurons. Error bars indicate SEMs of the number of cells indicated.
Figure 6.
Figure 6.
Activation and inhibition of GIRK by Oxo-M and reduction of inhibition after overexpression of PI5-K. A, Representative time plot of currents activated by 10 μm Oxo-M in individual control and PI5-K-overexpressing neurons. Currents were generated by 200 ms voltage ramps at 5 s intervals from -140 to -40 mV (C) and measured at -130 mV. Zero current baseline is that remaining after addition of 1 mm Ba2+. Note that Oxo-M produced initial current activation followed by inhibition and that inhibition was slowed in the PI5-K-overexpressing neuron. B, Mean ± SEM percentage inhibition of GIRK by 10 μm Oxo-M measured 30 s from the current peak in control neurons and neurons overexpressing PI5-K. Error bars indicate SEMs of the number of cells indicated. C, Muscarinic inhibition of GIRK preactivated by coexpression of G-protein βγ subunits. Currents were preactivated by injecting cDNA plasmids encoding Gβ1 and Gγ2 subunits 24 h previously. Cells were pretreated with Pertussis toxin (500 ng/ml overnight) to prevent any residual activation of GIRK by oxotremorine-M. The time plot shows current amplitudes recorded at -130 mV from voltage ramps. Records on the right show ramped currents recorded at the corresponding numbered times in the time plot. Oxo-M (10 μm) inhibited the current without previous activation (compare with A). Ba2+ (0.1 and 1 mm) further inhibited the current.
Figure 7.
Figure 7.
Displacement of membrane-associated GFP-PLCδ-PH by intracellular dialysis with IP3. A, Records showing the effect of breaking through with patch pipettes containing 0, 30, and 100 μm IP3 on cytosolic fluorescence in three sympathetic neurons expressing the GFP-PLCδ-PH construct. Initial fluorescence was measured over a cytoplasmic region of interest (Fig. 1) with the pipette in cell-attached configuration. Records show percentage change in this fluorescence after disrupting the patch (ΔF/F0 × 100%, where ΔF = F - F0, F is fluorescence after breakthrough, and F0 is baseline fluorescence before breakthrough). Inset, Images showing the distribution of fluorescence before and after pipette breakthrough. Note that, before breakthrough, fluorescence is localized primarily to the outer membrane but that, at the highest concentration of IP3, the fluorescence distributes uniformly with no clear membrane localization. B, Concentration dependence of IP3-induced change in cytosolic fluorescence ΔF/F0 × 100% (A), where F is peak fluorescence after breakthrough. Each point represents a measurement in a separate neuron. C, Concentration-response curve for IP3-induced GFP-PLCδ-PH membrane-to-cytosol translocation. The mean fluorescence change in 0 [IP3](-40%) was subtracted from the individual values for ΔF/F0 for each finite IP3 concentration in B and scaled to the mean value at 1 mm [IP3] (100%). Concentrations were corrected for phosphatase-induced IP3 breakdown as described in supplemental material 1 (available at www.jneurosci.org). Filled symbols indicate means and SEM of the transposed data points in B; open symbols indicate means and SEM of equivalent data at 30 and 100 μm [IP3] in cells preinjected with a cDNA plasmid encoding PI5-K. Curves are least-squares fits to the equation y = ymax · [IP3]/(IC50 + [IP3]). Mean values for IC50 were as follows: controls, 16.1 ± 1.24 μm; +PI5-K, 42.7 ± 9.4 μm.
Figure 9.
Figure 9.
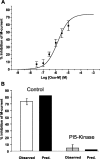
M-current inhibition calculated from the fluorescence measurements. Concentrations of PIP2 before and during application of oxotremorine-M were calculated from observed ΔF/F0 using the numerical data in Figure 8 B and converted to fractional M-channel availability (and thence percentage inhibition) from the KCNQ2/3 channel gating data of Zhang et al. (2003) (see Results). Numerical values used for the calculations are listed in Table 1. A, M-current inhibition calculated from the fluorescence data in Figure 3 (smooth curve) superimposed on the mean data points for the observed inhibition in Figure 3. The equation for the curve is y = ymax · xnH/(xnH + KnH), where x = log [Oxo-M] (M), K = -5.8 ± 0.1 (SEM; mean 1.6 μm [Oxo-M]), ymax = 74.0 ± 6.1% inhibition, and nH = 0.96 ± 0.13. B, Solid bars, Predicted (Pred.) M-current inhibition produced by 10 μm oxotremorine-M in control and PI5-K overexpressing neurons calculated from the fluorescence data in Figure 4C. Open and shaded bars are the observed percentage inhibition in the experiments shown in Figure 4 D. Error bars indicate SEMs of observed data (n values are as in Figs. 3 and 4).

Similar articles

Cited by

References

    1. Agard DA, Hiraoka Y, Shaw P, Sedat JW (1989) Fluorescence microscopy in three dimensions. Methods Cell Biol 30: 353-377. - PubMed
    1. Bender K, Wellner-Kienitz M-C, Pott L (2002) Transfection of a phosphatidyl-4-phosphate 5-kinase gene into rat atrial myocytes removes inhibition of GIRK current by endothelin and α-adrenergic agonists. FEBS Lett 529: 356-360. - PubMed
    1. Bernheim L, Mathie A, Hille B (1992) Characterization of muscarinic receptor subtypes inhibiting Ca2+ current and M current in rat sympathetic neurons. Proc Natl Acad Sci USA 89: 9544-9548. - PMC - PubMed
    1. Bofill-Cardona E, Vartian N, Nanoff C, Freissmuth M, Boehm S (2000) Two different signaling mechanisms involved in the excitation of rat sympathetic neurons by uridine nucleotides. Mol Pharmacol 57: 1165-1172. - PubMed
    1. Brown DA (1988) M-currents. In: Ion channels, Vol 1 (Narahashi T, ed), pp 55-99.New York: Plenum. - PubMed

Publication types

MeSH terms

Substances

LinkOut - more resources