. 2005 Mar 30;33(6):e54.
doi: 10.1093/nar/gni052.

A GFP-based reporter system to monitor nonsense-mediated mRNA decay

Affiliations

A GFP-based reporter system to monitor nonsense-mediated mRNA decay

Alexandra Paillusson et al. Nucleic Acids Res. .

Abstract

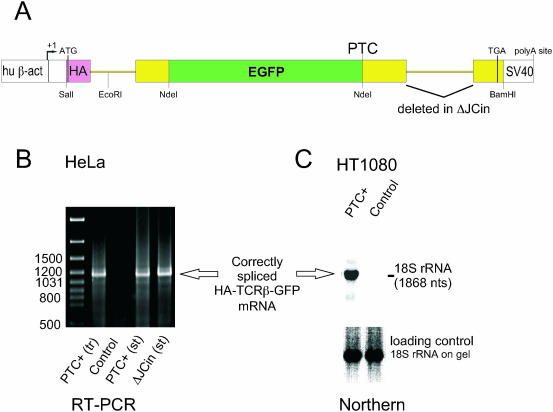
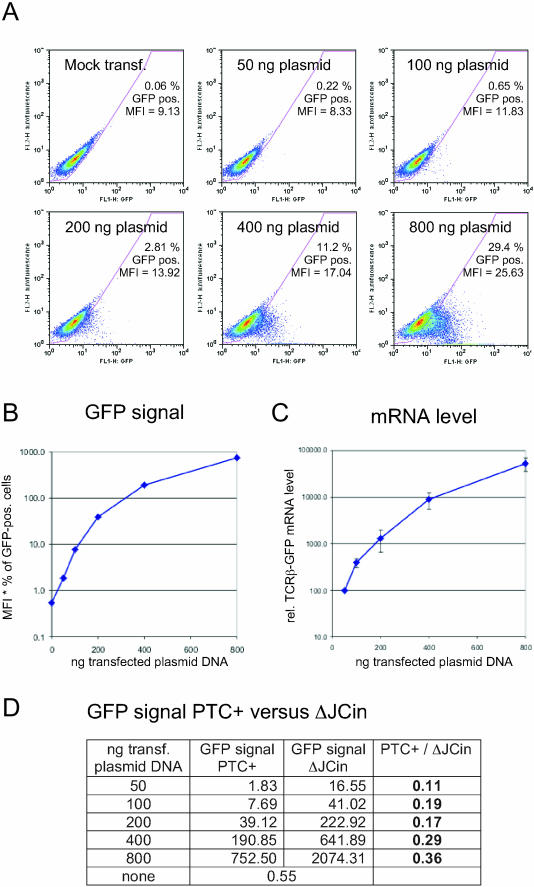
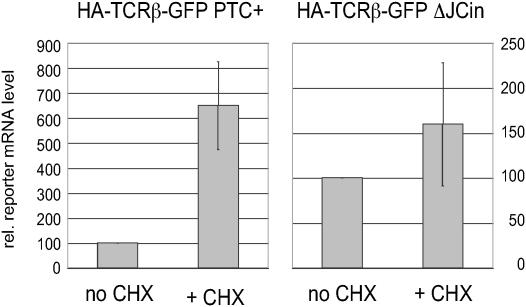
Aberrant mRNAs whose open reading frame (ORF) is truncated by the presence of a premature translation-termination codon (PTC) are recognized and degraded in eukaryotic cells by a process called nonsense-mediated mRNA decay (NMD). Here, we report the development of a reporter system that allows monitoring of NMD in mammalian cells by measuring the fluorescence of green fluorescent protein (GFP). The NMD reporter gene consists of a T-cell receptor-beta minigene construct, in which the GFP-ORF was inserted such that the stop codon of GFP is recognized as PTC. The reporter mRNA is therefore subjected to NMD, resulting in a low steady-state mRNA level, an accordingly low protein level and hence a very low green fluorescence in normal, NMD-competent cells that express this reporter gene. We show that the inactivation of NMD by RNAi-mediated knockdown of the essential NMD factor hUpf1 or hSmg6 increases the NMD reporter mRNA level, resulting in a proportional increase of the green fluorescence that can be detected by flow cytometry, spectrofluorometry and fluorescence microscopy. With these properties, our GFP-based NMD reporter system could be used for large-scale screenings to identify NMD-inhibiting drugs or NMD-deficient mutant cells.


Figures

Figure 1
Figure 1
Expression of the HA-TCRβ-GFP reporter gene yields correctly spliced mRNA. (A) Schematic representation of the NMD reporter gene. Sequences derived from human β-actin, mouse TCR-β and EGFP are shown in white, yellow and green, respectively. The haemagglutinin epitope (HA) is shown in purple. The positions of the transcription start site (+1), translation start codon (ATG), PTC and the normal stop codon (TGA) are depicted, and relevant restriction sites are indicated. The intron deleted in the control construct ΔJCin is marked. See text for details. (B) RNA from HeLa cells transiently (tr) or stably (st) expressing the HA-TCRβ-GFP reporter gene (PTC+) or the control construct with the deleted JC intron (ΔJCin) was reverse transcribed and amplified with primers annealing to the first and last exon. RNA from untransfected HeLa cells served as a negative control. The PCR products were resolved on a 1.5% agarose gel. (C) An aliquot of 10 μg RNA from HT1080 cells stably expressing the HA-TCRβ-GFP reporter gene (PTC+) and from untransfected HT1080 cells (control) was separated on a 1.2% agarose gel. After ethidium bromide staining of the gel to reveal the ribosomal RNAs (see 18S rRNA loading control), the RNA was transferred to a nylon membrane and hybridized with a 32P-labelled random-primed probe against TCRβ. The position on the membrane of the 18S rRNA is marked on the right.
Figure 2
Figure 2
The GFP fluorescence is proportional to the mRNA level of the reporter gene. (A) Forty-eight hours after transfection with the indicated amounts of the HA-TCRβ-GFP reporter gene together with a constant amount of a β-globin-expressing plasmid (41), the HeLa cells were analysed by flow cytometry. The gate for GFP positive cells was set so that the autofluorescence of the mock-transfected cells did not score as GFP positive. MFI, mean fluorescence intensity. (B) MFI values multiplied with the percentage of GFP positive cells from (A) were plotted against the amount of transfected NMD reporter plasmid DNA. (C) From an aliquot of the cells used in (A), RNA was isolated and relative NMD reporter mRNA and β-globin mRNA was measured by real-time RT–PCR. Relative reporter mRNA levels were normalized to relative β-globin mRNA levels, and average values and standard deviations of three real-time PCR runs are shown. (D) Analogous to the experiment shown in (A) and (B) for the PTC+ reporter gene, the GFP signals from cells transiently transfected with different amounts of the ΔJCin control construct were determined by flow cytometry. As in (B), the GFP signal is defined as MFI* % of GFP positive cells.
Figure 3
Figure 3
NMD reporter mRNA stably expressed in a single-cell clone increases upon inhibition of translation by CHX treatment. After transfection of HeLa cells with the NMD reporter gene (HA-TCRβ-GFP PTC+) or with the control construct (HA-TCRβ-GFP ΔJCin) and selection for G418 resistance, cell lines derived from single-cell clones were established. RNA was isolated from these cell lines after treatment with 100 μg/ml cycloheximide for 3 h (+CHX) or without CHX treatment (no CHX). Relative NMD reporter mRNA was measured by real-time RT–PCR and normalized to relative GAPDH mRNA levels. For each cell line, the NMD reporter mRNA level of non-treated cells was set to 100 and the mRNA level of the CHX treated cells is shown relative to it. Average values and standard errors of five real-time PCR runs are shown.
Figure 4
Figure 4
RNAi-mediated knockdown of essential NMD factors results in the expected increase of NMD reporter mRNA. (A) HeLa cell lines stably expressing the HA-TCRβ-GFP reporter construct (PTC+) or the control construct lacking the JC intron (ΔJCin) were transfected with pSUPERpuro plasmids expressing shRNAs against hUpf1, or with the empty pSUPERpuro (mock) as a control. After elimination of the non-transfected cells by treatment with puromycin, RNA was isolated 4 days post-transfection and relative NMD reporter mRNA was measured by real-time RT–PCR and normalized to relative GAPDH mRNA levels. Average values of three PCR runs from a typical experiment are shown. (B) The hUpf1 knockdown in the cells used in (A) was monitored by a western blot using hUpf1-specific polyclonal antisera. Cell extract of untransfected HeLa cells was used as a reference in the first lane. Detection of Sm proteins B/B′ with the monoclonal antibody Y12 served as loading control. (C) Average reporter mRNA levels determined from three independent knockdowns of hUpf1 or hSmg6 in the cell line expressing the NMD reporter construct (PTC+). The relative reporter mRNA levels were measured by real-time RT–PCR and normalized to relative GAPDH mRNA levels. Relative hUpf1 and hSmg6 mRNA levels were also determined to monitor the efficiency of the knockdowns. hUpf1 mRNA was ∼10-fold reduced compared with the mock, and hSmg6 mRNA ∼3-fold (data of one typical experiment is shown).
Figure 5
Figure 5
Detection of increased GFP fluorescence by flow cytometry analysis after RNAi-mediated knockdown of NMD factors. (A) hUpf1 or hSmg6 was knocked down in the NMD reporter gene-expressing HeLa cells as in Figure 4, and the cells were analysed by flow cytometry 4 days post-transfection. (B) From an aliquot of the same cells used for flow cytometry, relative reporter mRNA levels were determined by real-time RT–PCR. Average numbers of four PCR runs, normalized to endogenous GAPDH mRNA levels, are shown.
Figure 6
Figure 6
Detection of NMD deficiency by spectrofluorometry. (A) The GFP signal in extract corresponding to the indicated amount of cells from mock-transfected (black circles) and pSUPERpuro-hUpf1 transfected NMD reporter cells (grey squares), and from plain HeLa cells was measured with a dual scanning spectrofluorometer. The values measured in plain HeLa were used to subtract the background. RNAi was performed as in Figure 4. (B) Aliquots of the cells used in (A) were checked by western blotting using antibodies against hUPF1 (14) and the HA-tag to monitor the knockdown efficiency and the increase of the NMD reporter protein level, respectively. The two Sm proteins B and B′, detected with the monoclonal antibody Y12, served as loading control.
Figure 7
Figure 7
Detection of NMD deficiency by confocal laser scanning fluorescence microscopy. The NMD reporter cell line was grown on coverslips and transfected with the empty pSUPERpuro plasmid (mock; C and D) or with pSUPERpuro-Upf1 (E and F) as in Figure 4. Untransfected HeLa cells served as a control for background autofluorescence (A and B). After fixation, the cells were analysed using a confocal laser scanning fluorescence microscope. Differential interference contrast (DIC) images (A, C and E) and fluorescence images in the GFP channel (B, D and E) of the same cells are shown.

References

    1. Maquat L.E. Nonsense-mediated mRNA decay: splicing, translation and mRNP dynamics. Nature Rev. Mol. Cell Biol. 2004;5:89–99. - PubMed
    1. Frischmeyer P.A., Dietz H.C. Nonsense-mediated mRNA decay in health and disease. Hum. Mol. Genet. 1999;8:1893–1900. - PubMed
    1. Modrek B., Lee C. A genomic view of alternative splicing. Nature Genet. 2002;30:13–19. - PubMed
    1. Lewis B.P., Green R.E., Brenner S.E. Evidence for the widespread coupling of alternative splicing and nonsense-mediated mRNA decay in humans. Proc. Natl Acad. Sci. USA. 2003;100:189–192. - PMC - PubMed
    1. Mendell J.T., Dietz H.C. When the message goes awry. disease-producing mutations that influence mRNA content and performance. Cell. 2001;107:411–414. - PubMed

Publication types