Comparative Study
. 2005 Apr 7;48(7):2361-70.
doi: 10.1021/jm0491703.

A comparison of the binding sites of matrix metalloproteinases and tumor necrosis factor-alpha converting enzyme: implications for selectivity

Affiliations
Comparative Study

A comparison of the binding sites of matrix metalloproteinases and tumor necrosis factor-alpha converting enzyme: implications for selectivity

Viera Lukacova et al. J Med Chem. .

Abstract

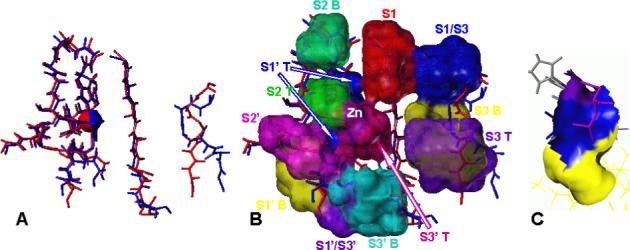
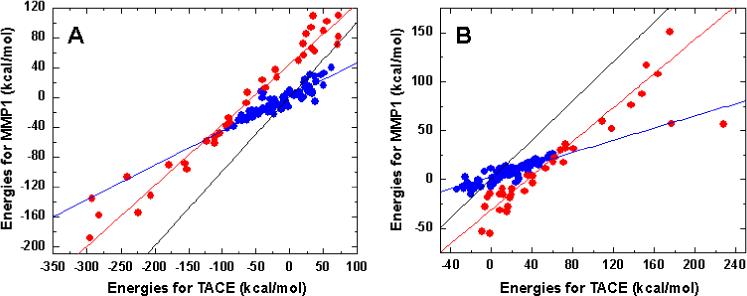
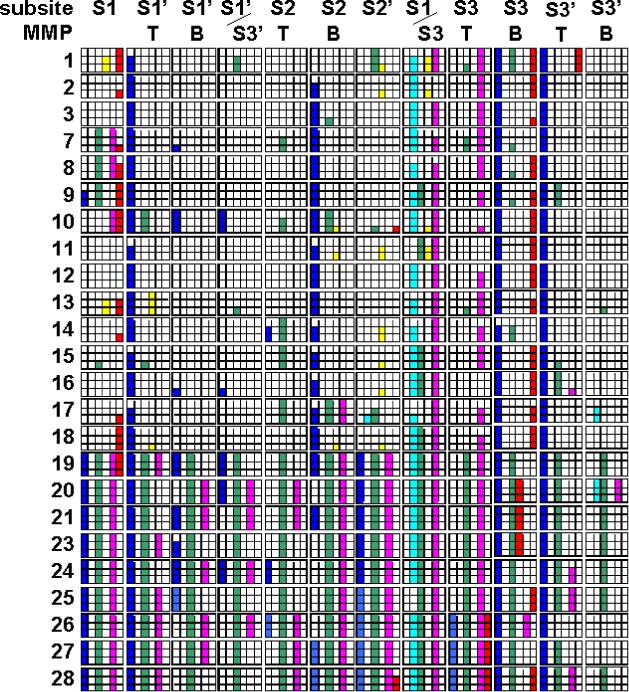
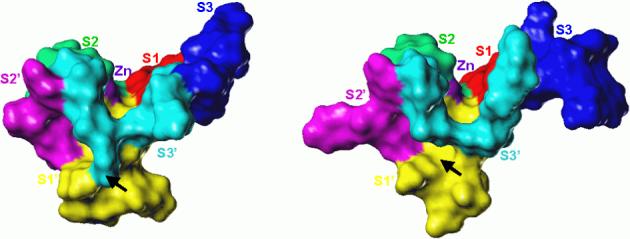
MMPs and TACE (ADAM-17) assume independent, parallel, or opposite pathological roles in cancer, arthritis, and several other diseases. For therapeutic purposes, selective inhibition of individual MMPs and TACE is required in most cases due to distinct roles in diseases and the need to preserve activities in normal states. Toward this goal, we compared force-field interaction energies of five ubiquitous inhibitor atoms with flexible binding sites of 24 known human MMPs and TACE. The results indicate that MMPs 1-3, 10, 11, 13, 16, and 17 have at least one subsite very similar to TACE. S3 subsite is the best target for development of specific TACE inhibitors. Specific binding to TACE compared to most MMPs is promoted by placing a negatively charged ligand part at the bottom of S2 subsite, at the entrance of S1' subsite, or the part of S3' subsite that is close to catalytic zinc. Numerous other clues, consistent with available experimental data, are provided for design of selective inhibitors.


Figures

Figure 1
Figure 1
Identification of subsites in the catalytic domain of TACE (PDB file 1BKC). A-D: bound ligand is shown in magenta, the identified residues outlining individual subsites are shown in red, catalytic zinc is shown as a blue sphere. A: S2 subsite is defined by residues between His409 and His415 coordinating catalytic zinc, B: S1’ subsite is defined by an α-helix positioned around the third His405coordinating catalytic zinc, C: S1 and one side of S3’ subsites are outlined by the β-sheet along the bound ligand, D: the residues outlining the other side of S3’ continuing into the S2’ subsite. E: the entire catalytic domain with highlighted residues forming the five subsites as identified in A-D. The parts of the ribbon representing individual subsites are marked as S1-red, S1’-yellow, S2-green, S2’-purple, S3’-cyan. The three coordinating His residues are highlighted in colors corresponding to the subsites and the bound ligand is shown in magenta.
Figure 2
Figure 2
Superimposed structures of TACE (PDB file 1BKC, blue) and MMP-7 (PDB file 1MMQ, red). A - backbone atoms of residues in individual subsites, catalytic zinc (spheres), and side chains of the three coordinating His residues are shown. The backbone structures of five subsites show nearly perfect match, while those of S3 subsites differ and were not used in the superposition. B - the backbones are overlaid with the definitions of the parts of binding site as used in analyzing the differences. S1: red, S1’T: blue, S1’B: yellow, S1’/S3’: purple, S2T: yellow-green, S2B: blue-green, S2’: magenta, S1/S3: blue, S3T: purple, S3B: yellow, S3’T: dark magenta, S3’B: cyan. The parts of individual subsites close to the protein surface and/or to catalytic zinc are marked as top (T), the parts buried in the protein and/or distant from the catalytic zinc are marked as bottom (B). C – the detailed view of one of the subsites (S1’) showing the definition of the top (blue) and bottom (yellow) part of the subsite. The purple color marks the surface of catalytic zinc. The portion of bound ligand interacting with S1’ subsite (magenta) and zinc coordinating His residues are shown.
Figure 3
Figure 3
Relatedness of subsites in TACE and in individual MMPs expressed as the explained variances of linear relationships between the interaction energies for TACE versus individual MMPs for each probe and subsite. The rows correspond to individual MMPs. The six major columns correspond to individual probes (the 6th column represents combination of all probes), which are further divided into individual subsites. Summary correlations for entire binding site (all) and the binding site excluding S3 subsite (all*) were also calculated. The box colors indicate the level of explained variance (in %): 90−100 (red), 80−89 (amber), 70−79 (tan), 60−69 (gold), 50−59 (yellow), 40−49 (white), 30−39 (aqua), 20−29 (light blue), 10−19 (medium blue), and 0−9 (dark blue).
Figure 4
Figure 4
Correlation of interaction energies in S3’ subsite in TACE and MMP-1, illustrating changing properties of the subsite as it extends away from the catalytic zinc. A: negative carbonyl oxygen probe, B: positive sp3 nitrogen probe. Results for positive hydrogen probe were similar as shown in B. Colors of points indicate the distance from the catalytic zinc: close – within 4Å (red points), far – more than 4 Å (blue points). Fitted lines are as follows: identity line (black), region close to catalytic zinc (red), far region (blue).
Figure 5
Figure 5
The regions of the binding site responsible for specific interactions of probes with TACE. The 24 major rows correspond to individual MMPs. Each major row is split into three additional rows according to difference level: 90, 80, and 70% (top to bottom). The major columns correspond to specific parts of the binding site (Figure 2). Each major column is split into six columns showing the preference for probe types by TACE or MMP: negative probe preferred by TACE (blue box) or by particular MMP (cyan box), neutral probe preferred by TACE (green box) or by particular MMP (yellow box), positively charged probe preferred by TACE (magenta box) or by particular MMP (red box).
Figure 6
Figure 6
Comparison of S1’/S3’ regions of TACE (PDB file 1BKC, right) and MMP-8 (PDB file 1JAN, left). Colors identify catalytic zinc and individual subsites: zinc (purple), S1 (red), S1’ (yellow), S2 (green), S2’ (magenta), S3 (blue), S3’ (cyan). In TACE, S1’ and S3’ subsites are separated only on the surface by the side chains of the two residues (Ala439 and Leu348), while in the MMP structure the two subsites are completely separated. The arrows mark the regions where the subsites S1’ and S3’ are merged and separated in TACE and MMP, respectively.

Similar articles

Cited by

References

    1. Sternlicht MD, Coussens LM, Vu TH, Werb Z. Biology and regulation of the matrix metalloproteinases. In: Clendeninn NJ, Appelt K, editors. Matrix Metalloproteinase Inhibitors in Cancer Therapy. Humana Press; Totowa, NJ: 2000. pp. 1–37.
    1. Chakraborti S, Mandal M, Das S, Mandal A, Chakraborti T. Regulation of matrix metalloproteinases: An overview. Mol. Cell. Biochem. 2003;253:269–285. - PubMed
    1. Gee JMW, Knowlden JM. ADAM metalloproteases and EGFR signaling. Breast Cancer Res. 2003;5:223–224. - PMC - PubMed
    1. Stahl M, Taroni C, Schneider G, Hoffmann F. Mapping of protein surface cavities and prediction of enzyme class by a self-organizing neural network. Protein Eng. 2000;13:83–88. - PubMed
    1. Blobel CP. Functional and biochemical characterization of ADAMs and their predicted role in protein ectodomain shedding. Inflamm. Res. 2002;51:83–84. - PubMed

Publication types