. 2005 Feb;7(2):109-17.
doi: 10.1593/neo.04436.

Ferritin as an endogenous MRI reporter for noninvasive imaging of gene expression in C6 glioma tumors

Affiliations

Ferritin as an endogenous MRI reporter for noninvasive imaging of gene expression in C6 glioma tumors

Batya Cohen et al. Neoplasia. 2005 Feb.

Abstract

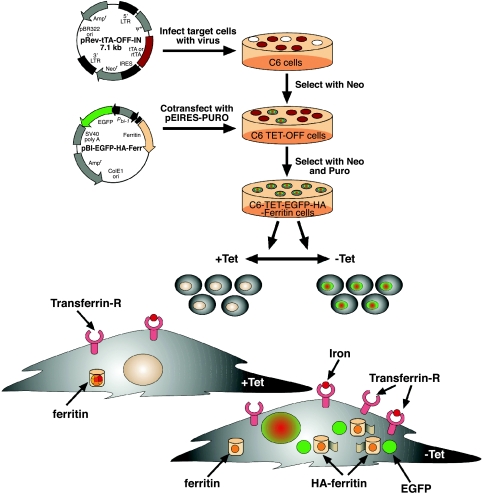
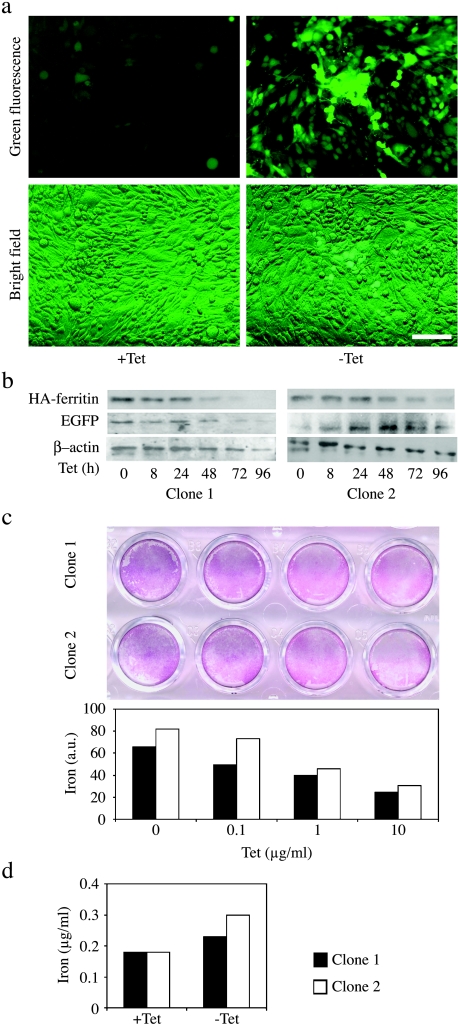
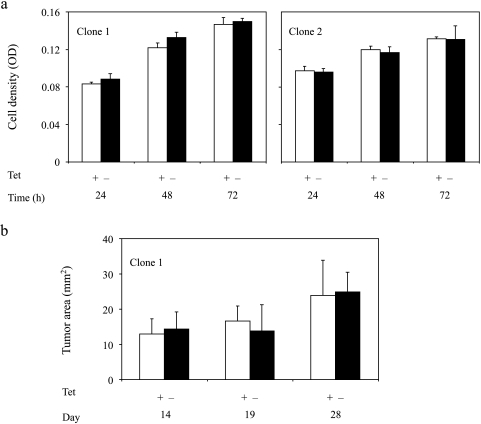
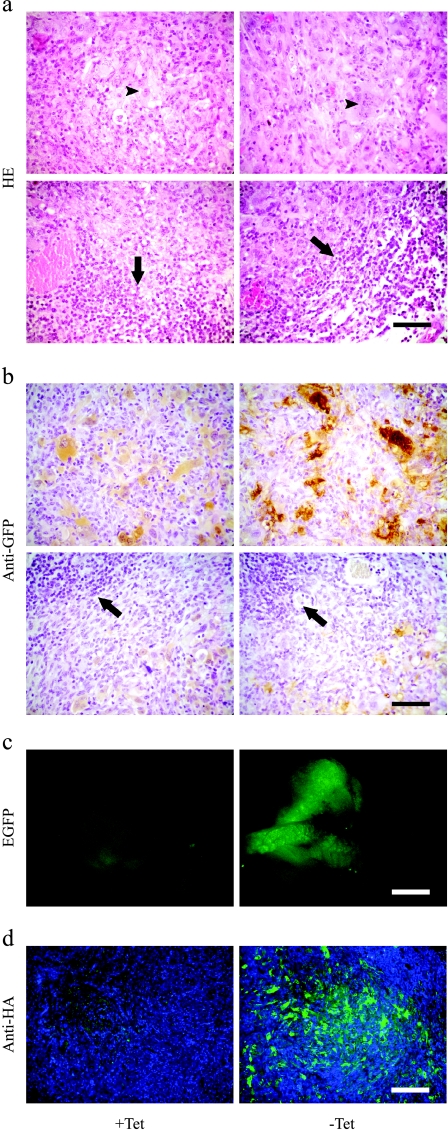
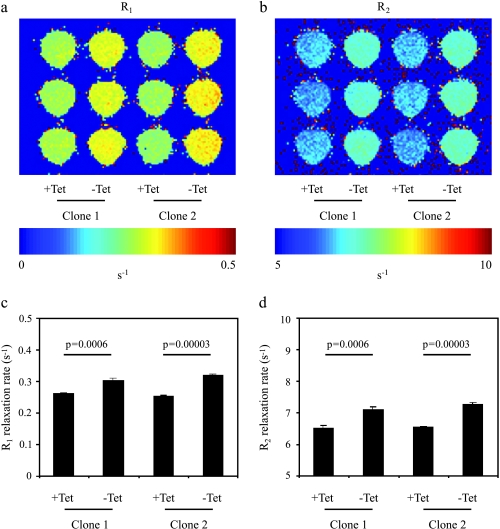
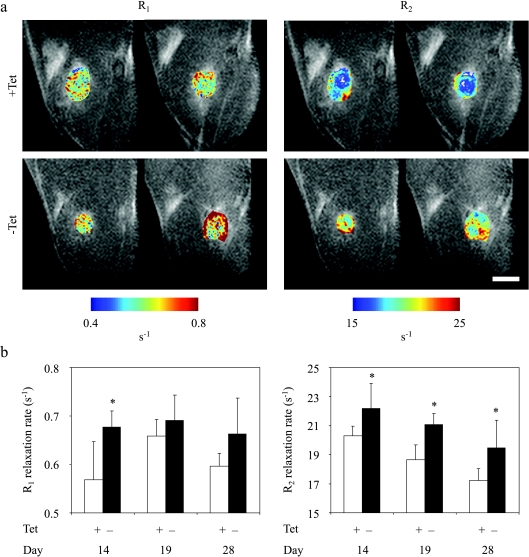
The heavy chain of murine ferritin, an iron storage molecule with ferroxidase activity, was developed as a novel endogenous reporter for the detection of gene expression by magnetic resonance imaging (MRI). Expression of both enhanced green fluorescent protein (EGFP) and influenza hemagglutinin (HA)-tagged ferritin were tightly coregulated by tetracycline (TET), using a bidirectional expression vector. C6 cells stably expressing a TET-EGFP-HA-ferritin construct enabled the dynamic detection of TET-regulated gene expression by MRI, followed by independent validation using fluorescence microscopy and histology. MR relaxation rates were significantly elevated both in vitro and in vivo on TET withdrawal, and were consistent with induced expression of ferritin and increase in intracellular iron content. Hence, overexpression of ferritin was sufficient to trigger cellular response, augmenting iron uptake to a degree detectable by MRI. Application of this novel MR reporter gene that generates significant contrast in the absence of exogenously administered substrates opens new possibilities for noninvasive molecular imaging of gene expression by MRI.


Figures

Figure 1
Figure 1
TET-regulated expression of EGFP-HA-ferritin as a multimodality endogenous reporter of gene expression for MRI and optical imaging. C6-TET-EGFP-ferritin was generated by the infection of C6 cells with viruses carrying the TET transactivator (tTA) under a constitutive promoter (pRev-tTA-OFF-IN vector). The cells were then transfected to express TET-EGFP-HA-ferritin using a bidirectional vector (pBI-EGFP-HA-Ferr vector). Selected clones showed overexpression of EGFP and HA-tagged ferritin, both of which were tightly suppressed by administration of TET (+Tet). In the absence of TET (-Tet), overexpression of ferritin leads to redistribution of intracellular ferritin iron and chelation of intracellular free iron, thereby generating MR contrast by increasing R1 and R2 relaxation rates. Iron homeostasis is restored by the compensatory expression of transferrin receptor and increased iron uptake, providing further gain in MR contrast.
Figure 2
Figure 2
TET-regulated expression of EGFP-HA-ferritin in C6 rat glioma cells augments iron uptake. (a) C6-TET-EGFP-HA-ferritin cells (clone 2) were grown in culture plates in the presence or absence of TET (48 hours; 1 µg/ml). Confluent cell layers were examined for EGFP fluorescence (upper panel) and in combination with bright field (lower panel). Scalebar = 50 µm. (b) Time-dependent expression of EGFP and HA-ferritin in C6 cells as a response to TET switch (1 µg/ml) was determined by Western blot analysis. β-Actin was used to normalize protein amounts. (c) Prussian Blue analysis of dose-dependent TET-induced (48 hours) iron uptake into the cells. Staining intensity was quantified by NIH image. (d) Quantification of intracellular iron content by ICP-AES (1 µg/ml; 48 hours). Close and open bars represent clones 1 and 2, respectively.
Figure 3
Figure 3
Expression of ferritin does not affect the growth of C6-TET-EGFP-HA-ferritin cells in vitro or in vivo. (a) In vitro growth rate of C6-TET-EGFP-HA-ferritin cells cultured in the absence or presence of TET (1 µg/ml; up to 72 hours) calculated using neutral red assay (n = 3-5; mean ± SD). (b) In vivo growth rate of C6-TET-EGFP-HA-ferritin tumors measured from MR images. C6-TET-EGFP-HA-ferritin cells (clone 1) were inoculated in the hind limb of nude mice and the mice were supplied with TET and sucrose (n = 7; or sucrose only, n = 4) in drinking water for 4 weeks (mean ± SD).
Figure 4
Figure 4
TET-regulated overexpression of EGFP-HA-ferritin in tumors. C6-TET-EGFP-HA-ferritin cells (clone 1) were inoculated in the hind limb of nude mice. TET and sucrose (or sucrose only) were supplied in drinking water and the tumors were retrieved for histology at the end of 4 weeks. (a) Histologic sections stained with hematoxylin-eosin. Multinucleated giant tumor cells (arrowheads) and infiltrating inflammatory cells at the tumor rim (arrows) are indicated. (b) Histologic sections stained with anti-GFP polyclonal antibody (brown), counterstained with hematoxylin. (c) Expression of EGFP in subcutaneous tumors and skin whole mounts visualized by fluorescent microscopy. (d) Histologic sections stained with fluorescent anti-HA antibody (green) and nuclear stain (Hoechst, Molecular Probes, Inc., Eugene, OR; blue). Scalebar = 50 µm (a and b), 1 mm (c), and 200 µm (d).
Figure 5
Figure 5
In vitro MRI detection of switchable ferritin expression in C6 rat glioma cells. (a and b) R1 and R2 relaxation rate maps of C6-TET-EGFP-HA-ferritin cell samples suspended in agarose and placed in a 96-well plate. Two clones are shown incubated with and without TET (5 days; 1 µg/ml). (c and d) Relaxation rates derived from the R1 and R2 maps (mean ± SD; n = 3, P values: two-tailed unpaired t-test).
Figure 6
Figure 6
In vivo MRI detection of switchable ferritin expression in C6 tumors. MRI of ferritin-expressing tumors at different times after inoculation of C6-TET-EGFP-HA-ferritin tumor cells (clone 1) in the hind limb of nude mice. TET and sucrose (or sucrose only) were supplied in drinking water, starting 2 days before inoculation. (a) R1 and R2 maps of tumor regions overlaid on the MR images are shown for two representative mice from each group. (b) R1 and R2 values (mean ± SD) at the tumor region in the presence (ferritin off; n = 7) or absence (ferritin on; n = 4) of TET in drinking water. All four -Tet mice were imaged three times each (on days 14, 19, and 28 after tumor inoculation). All seven +Tet mice were imaged on the first (day 14) and second (day 19) MRI sessions, and five of these mice were scanned also on the third (day 28) session. *P < .05: two-tailed unpaired t-test. Scalebar = 2.5 mm.

Similar articles

Cited by

References

    1. Sipkins DA, Cheresh DA, Kazemi MR, Nevin LM, Bednarski MD, Li KC. Detection of tumor angiogenesis in vivo by alphaVbeta3-targeted magnetic resonance imaging. Nat Med. 1998;4:623–626. - PubMed
    1. Weissleder R, Moore A, Mahmood U, Bhorade R, Benveniste H, Chiocca EA, Basilion JP. In vivo magnetic resonance imaging of transgene expression. Nat Med. 2000;6:351–355. - PubMed
    1. Winter PM, Morawski AM, Caruthers SD, Fuhrhop RW, Zhang H, Williams TA, Allen JS, Lacy EK, Robertson JD, Lanza GM, Wickline SA. Molecular imaging of angiogenesis in early-stage atherosclerosis with alpha(v)beta3-integrin-targeted nanoparticles. Circulation. 2003;108:2270–2274. - PubMed
    1. Artemov D, Mori N, Ravi R, Bhujwalla ZM. Magnetic resonance molecular imaging of the HER-2/neu receptor. Cancer Res. 2003;63:2723–2727. - PubMed
    1. Kircher MF, Josephson L, Weissleder R. Ratio imaging of enzyme activity using dual wavelength optical reporters. Mol Imaging. 2002;1:89–95. - PubMed

Publication types

MeSH terms

LinkOut - more resources