

Dynamics of nitrogen uptake and mobilization in field-grown winter oilseed rape (Brassica napus) from stem extension to harvest. II. An 15N-labelling-based simulation model of N partitioning between vegetative and reproductive tissues
- PMID: 15802311
- PMCID: PMC4246903
- DOI: 10.1093/aob/mci131
Dynamics of nitrogen uptake and mobilization in field-grown winter oilseed rape (Brassica napus) from stem extension to harvest. II. An 15N-labelling-based simulation model of N partitioning between vegetative and reproductive tissues
Abstract
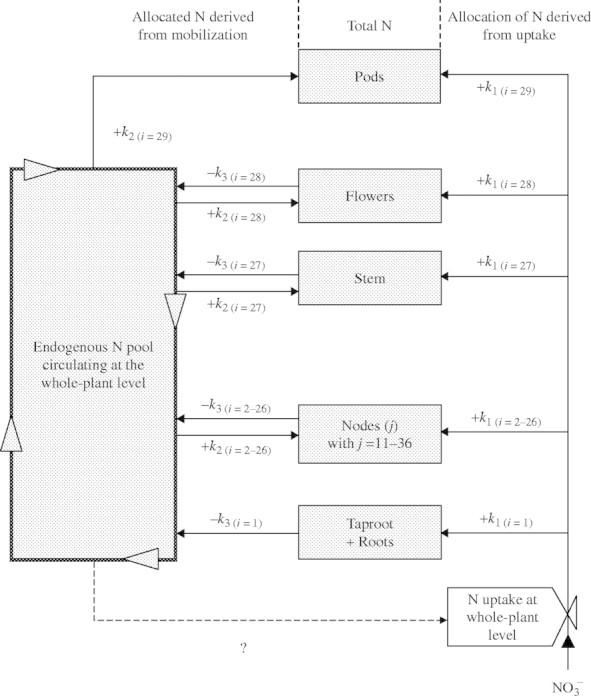
Background and aims: Oilseed rape (Brassica napus) has often been used as a catch crop to deal with the issue of N leaching, but for this to be effective, prediction of the crop's N uptake capability and N partitioning is required. The aim of this work was to build a compartmental model of N dynamics in oilseed rape, based on the kinetic description of N uptake, partitioning and mobilization in each organ.
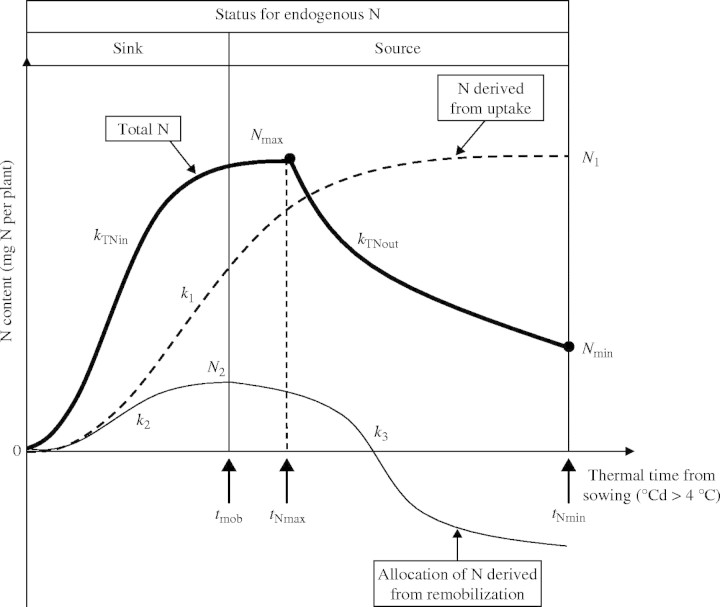
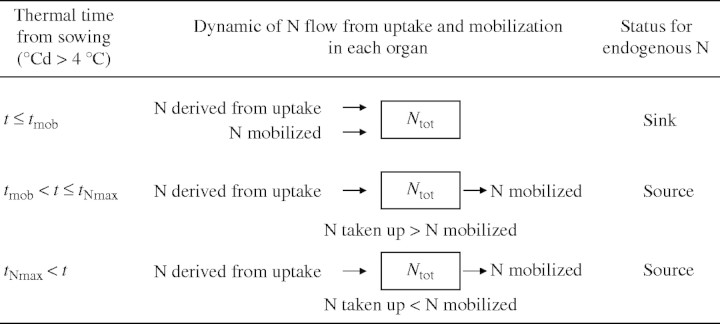
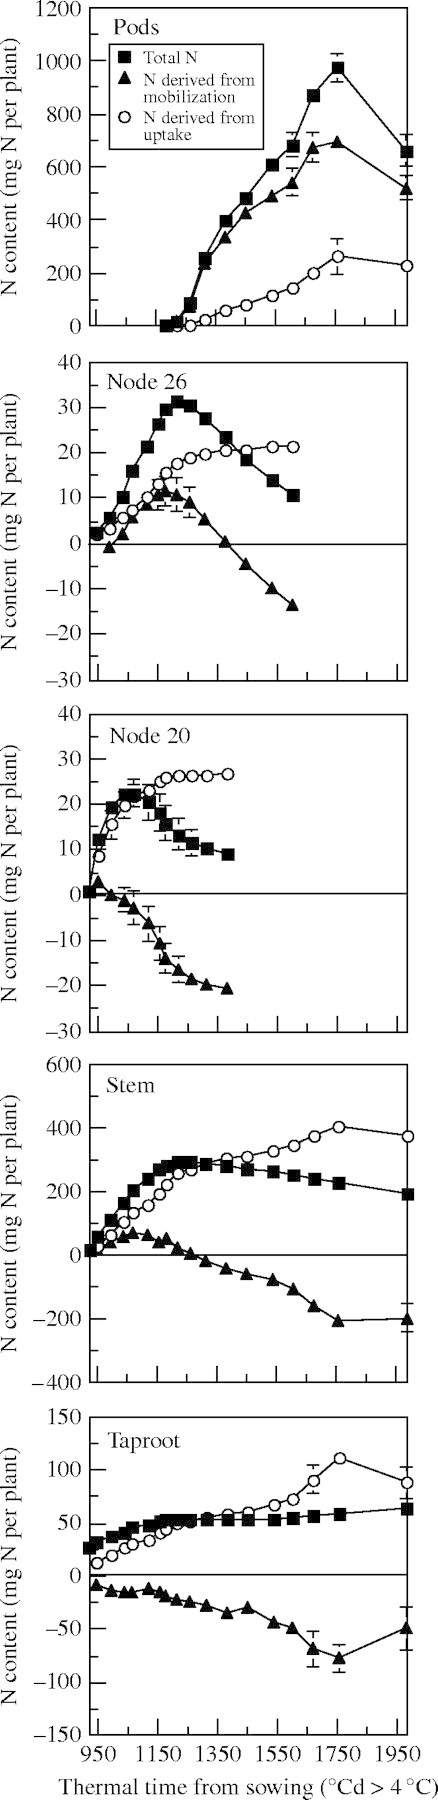
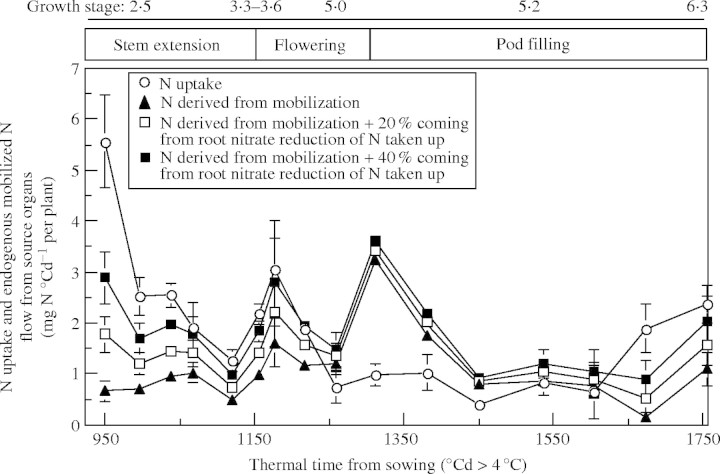
Model: In this study, logistic and exponential equations were fitted to the N relations of each compartment, especially the leaf at each node. Data previously obtained from an 15N-labelling field experiment was used to quantify the partitioning of total N content, the allocation of N taken up and subsequent changes in the sink/source status for endogenous N in each tissue throughout the growth cycle.
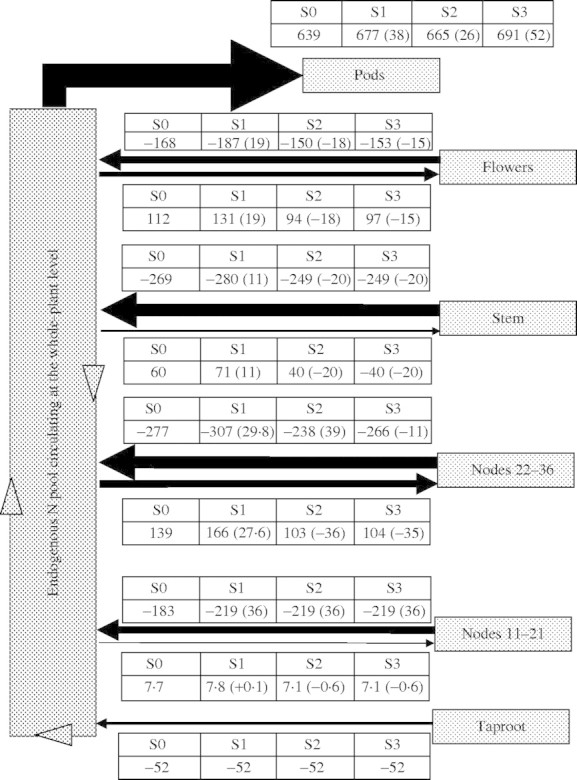
Key results and conclusions: This modelling approach provides a unique tool for the quantitative estimation of cycling of endogenous N in relation to changes in N uptake at the whole-plant level. Furthermore, as oilseed rape is known to release large amounts of N to the soil during spring through leaf loss, this model was used to identify potential methods for improving the N harvest index of the crop. Simulations showed that N content or yield could be improved by 15% by optimizing N transfer from vegetative to reproductive tissues and by reducing the residual %N (DW) in abscised leaves.
Figures
References
-
- Bancal P, Soltani F. 2002. Source–sink partitioning. Do we need Münch? Journal of Experimental Botany 53: 1919–1928. - PubMed
-
- Buchanan-Wollaston V, Earl S, Harisson E, Mathas E, Navabpour S, Page T, Pink D. 2003. The molecular analysis of leaf senescence—a genomics approach. Plant Biotechnology Journal 1: 3–22. - PubMed
-
- Charles-Edwards DA, Stutzel H, Ferraris R, Beech DF. 1987. An analysis of spatial variation in the nitrogen content of leaves from different horizons within the canopy. Annals of Botany 60: 421–426.
-
- Colnenne C, Meynard JM, Reau R, Justes E, Merrien A. 1998. Determination of a critical nitrogen dilution curve for winter oilseed rape. Annals of Botany 81: 311–317.
-
- Dejoux JF. 1999.Evaluation d'itinéraires techniques du colza d'hiver en semis très précoces. Analyse agronomique, conséquences environnementales et économiques. Ph.D. thesis, Institut National Agronomique, Paris–Grignon, France.
MeSH terms
Substances
LinkOut - more resources
Full Text Sources
Other Literature Sources
