

Comparative Study
doi: 10.1073/pnas.0501646102.
Epub 2005 Mar 31.
Symmetrical base preferences surrounding HIV-1, avian sarcoma/leukosis virus, and murine leukemia virus integration sites
Affiliations
- PMID: 15802467
- PMCID: PMC1087937
- DOI: 10.1073/pnas.0501646102
Item in Clipboard
Comparative Study
Symmetrical base preferences surrounding HIV-1, avian sarcoma/leukosis virus, and murine leukemia virus integration sites
Proc Natl Acad Sci U S A.
.
Erratum in
- Proc Natl Acad Sci U S A. 2005 Apr 26;102(17):6238
Abstract
To investigate retroviral integration targeting on a nucleotide scale, we examined the base frequencies directly surrounding cloned in vivo HIV-1, murine leukemia virus, and avian sarcoma/leukosis virus integrations. Base preferences of up to 2-fold the expected frequencies were found for three viruses, representing P values down to <10(-100) and defining what appear to be preferred integration sequences. Offset symmetry reflecting the topology of the integration reaction was found for HIV-1 and avian sarcoma/leukosis virus but not murine leukemia virus, suggesting fundamental differences in the way different retroviral integration complexes interact with host-cell DNA.
Figures
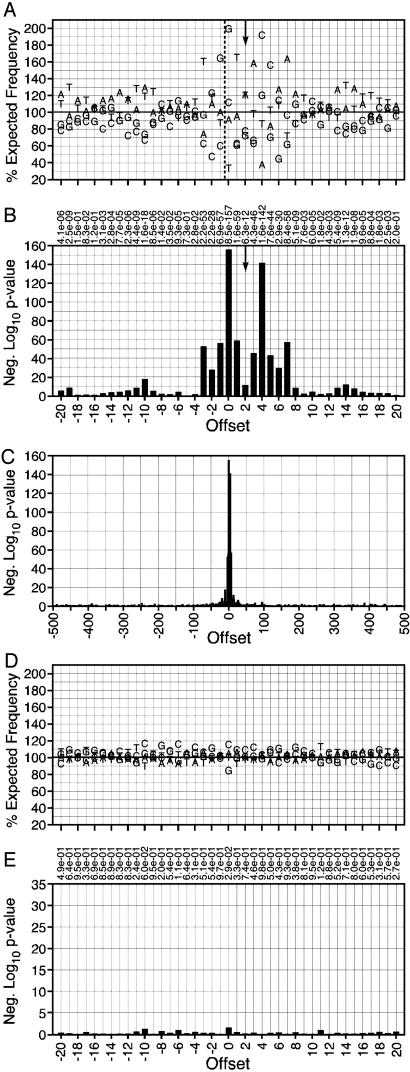
Base preferences directly surrounding cloned HIV-1 integration sites. (A) Preferences around the HIV-1 integration site. Base frequencies relative to the integration site of the 5′ LTR end are shown. The vertical arrow indicates the expected axis of symmetry based on the characteristic five-base spacing between the sites of HIV-1 DNA integration. The x axis shows the offset for each base from the integration site. Sequences have been aligned so that all integrations fall between offsets -1 and 0, as indicated by the black dashed vertical line. The y axis represents the percent of the expected frequency observed for each base (58% A/T, 42% G/C). The horizontal line is drawn at 100% of the expected frequency. (B) P values obtained by χ2 analysis comparing observed base frequencies with the expected frequencies. The y axis indicates the negative log10 of the P value. Taller bars indicate a more significant P value. Actual P values for each offset are shown at the top of the section. (C) Negative log10 of P values seen within the entire region 500 bases 5′ and 3′ from the integration site. (D) Base preferences directly surrounding mock integration sites in randomly selected genomic sites. Conventions are as in A.(E) P values of the base preferences surrounding mock integration sites in randomly selected genomic sites. Conventions are as in B.
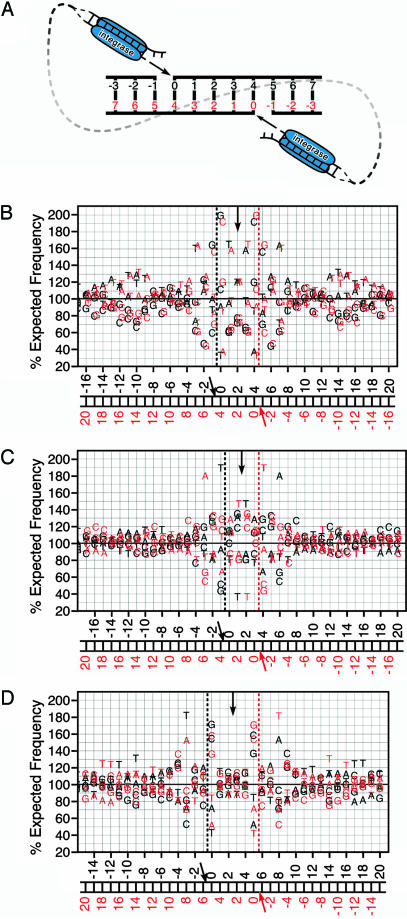
Comparison of the observed integration preferences to the inferred preferences for the opposite LTR. (A) Schematic of the topology of HIV-1 integration. HIV-1 integration complexes join the viral LTRs to opposite strands of the DNA separated by five bases. MLV joins with an offset of four bases, whereas ASLV uses a six-base offset (not pictured). (B) Symmetry observed in HIV-1 with five-base offset. Black lettering represents the base preference seen from the top LTR (Fig. 1). The integration site is indicated by the black dashed vertical line in the graph and the black arrow in the numbering schematic. The vertical arrow indicates the expected axis of symmetry based on the characteristic five-base spacing between the sites of HIV-1 DNA integration. The red lettering represents the same base preferences; however, they are reversed and shifted five bases to represent the preferences as observed from the bottom LTR. The inferred integration site is indicated by the red vertical line in the graph and the red arrow in the numbering schematic. (C) Symmetry observed in MLV with four-base offset. (D) Symmetry observed in ALV with six-base offset.
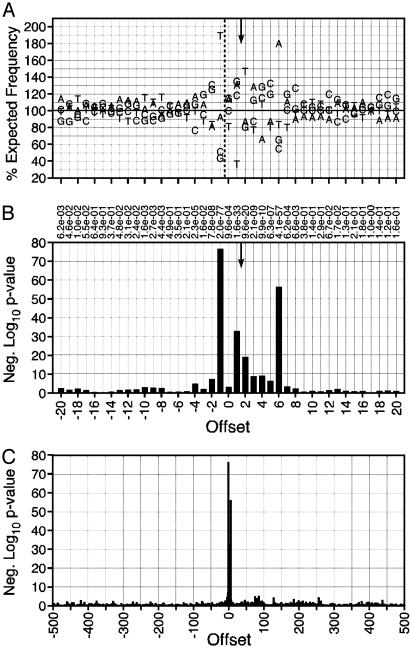
Base preferences directly surrounding cloned MLV integration sites. Conventions are as in Fig. 1, except that the symmetry is based on a four-base offset between integration sites.
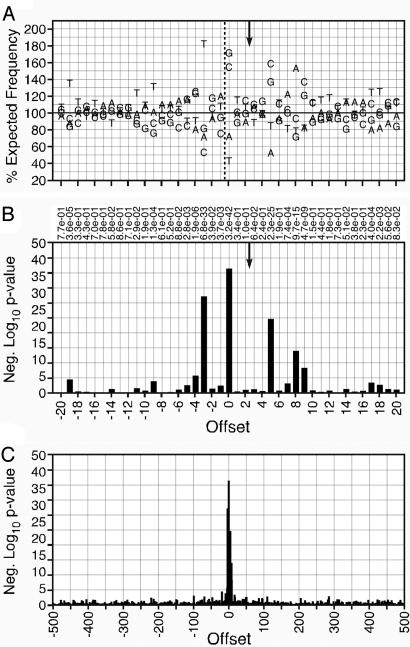
Base preferences directly surrounding cloned ASLV integration sites. Conventions are as in Fig. 1, except that the symmetry is based on a six-base offset between integration sites.
Comment in
-
Symmetrical recognition of cellular DNA target sequences during retroviral integration.Proc Natl Acad Sci U S A. 2005 Apr 26;102(17):5903-4. doi: 10.1073/pnas.0502045102. Epub 2005 Apr 19. Proc Natl Acad Sci U S A. 2005. PMID: 15840713 Free PMC article. No abstract available.
References
Publication types
MeSH terms
Grants and funding
LinkOut - more resources
Full Text Sources
