. 2005 Apr 12;102(15):5443-7.
doi: 10.1073/pnas.0501562102. Epub 2005 Mar 31.

Interaction strength combinations and the overfishing of a marine food web

Affiliations

Interaction strength combinations and the overfishing of a marine food web

Jordi Bascompte et al. Proc Natl Acad Sci U S A. .

Abstract

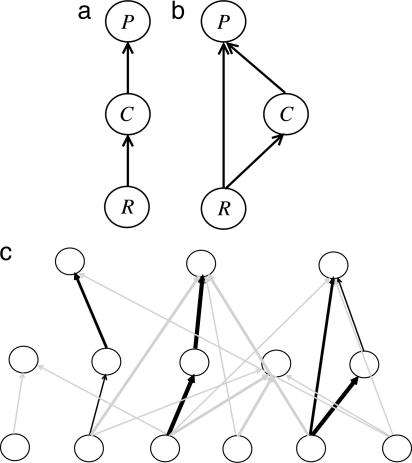
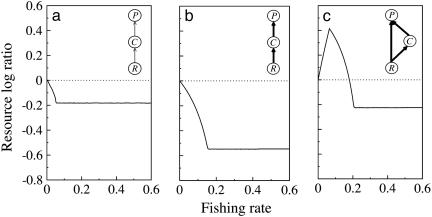
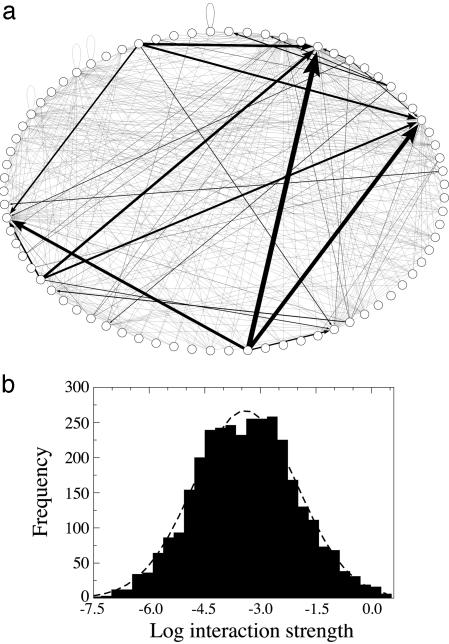
The stability of ecological communities largely depends on the strength of interactions between predators and their prey. Here we show that these interaction strengths are structured nonrandomly in a large Caribbean marine food web. Specifically, the cooccurrence of strong interactions on two consecutive levels of food chains occurs less frequently than expected by chance. Even when they occur, these strongly interacting chains are accompanied by strong omnivory more often than expected by chance. By using a food web model, we show that these interaction strength combinations reduce the likelihood of trophic cascades after the overfishing of top predators. However, fishing selectively removes predators that are overrepresented in strongly interacting chains. Hence, the potential for strong community-wide effects remains a threat.


Figures

Fig. 1.
Fig. 1.
The building blocks of complex food webs. (a) TFC. (b) TFC with omnivory. Nodes from top to bottom represent the top predator (P), the consumer (C), and the resource (R). Arrows represent trophic links. (c) Schematic representation of a food web highlighting three TFCs (one of them with omnivory). The central food chain shows cooccurrence of two strong interaction strengths, the combination explored in this paper.
Fig. 3.
Fig. 3.
Response of the resource as a function of the fraction of predators fished in TFCs with two weak interactions (a), two strong interactions (b), and food chains with omnivory and three strong interactions (c), based on a bioenergetic model (see Materials and Methods). The magnitude of the trophic cascade (measured as the resource log ratio) is greater for food chains with two strong interactions (compare a with b), and it is reduced when there is a similarly strong omnivory link (compare b with c). The dotted line is used as a reference. Parameter combinations are specified in Materials and Methods.
Fig. 2.
Fig. 2.
Interaction strength variability. (a) Random sample of the Caribbean food web containing 30% of the species and 11% of the interactions. Each node represents a species or taxon. Arrows represent trophic interactions between predators and their prey. Arrow thickness is proportional to the interaction strength. Loops represent cannibalism. (b) Frequency distribution of interaction strengths (n = 3,313) spanning seven orders of magnitude. The line represents the best fit to a lognormal distribution.

References

    1. Ulanowicz, R. E. & Wolff, W. F. (1991) Math. Biosci. 103, 45–68. - PubMed
    1. Paine, R. T. (1992) Nature 355, 73–75.
    1. Fagan, W. F. & Hurd, L. E. (1994) Ecology 75, 2022–2032.
    1. Raffaelli, D. & Hall, S. (1995) in Food Webs: Integration of Patterns and Dynamics, eds. Polis, G. & Winemiller, K. (Chapman & Hall, New York), pp. 185–191.
    1. Wootton, J. T. (1997) Ecol. Monogr. 67, 45–64.

Publication types