. 2005 Jun;170(2):661-74.
doi: 10.1534/genetics.104.039701. Epub 2005 Mar 31.

Subdivision of large introns in Drosophila by recursive splicing at nonexonic elements

Affiliations

Subdivision of large introns in Drosophila by recursive splicing at nonexonic elements

James M Burnette et al. Genetics. 2005 Jun.

Abstract

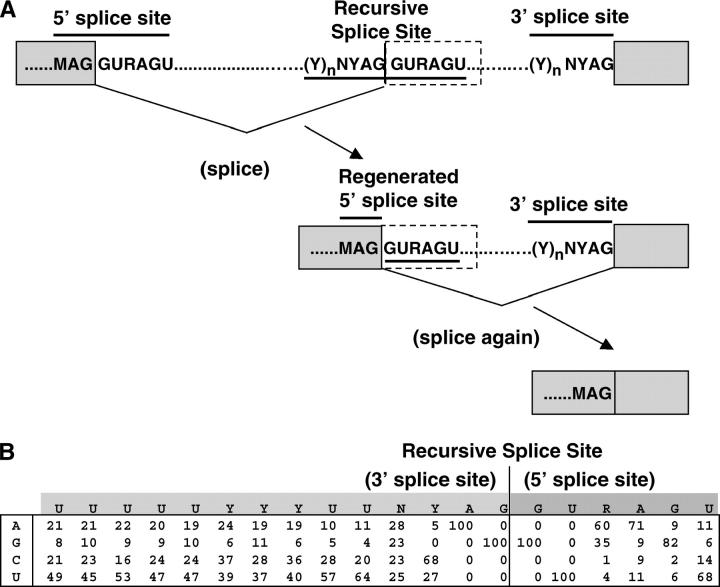
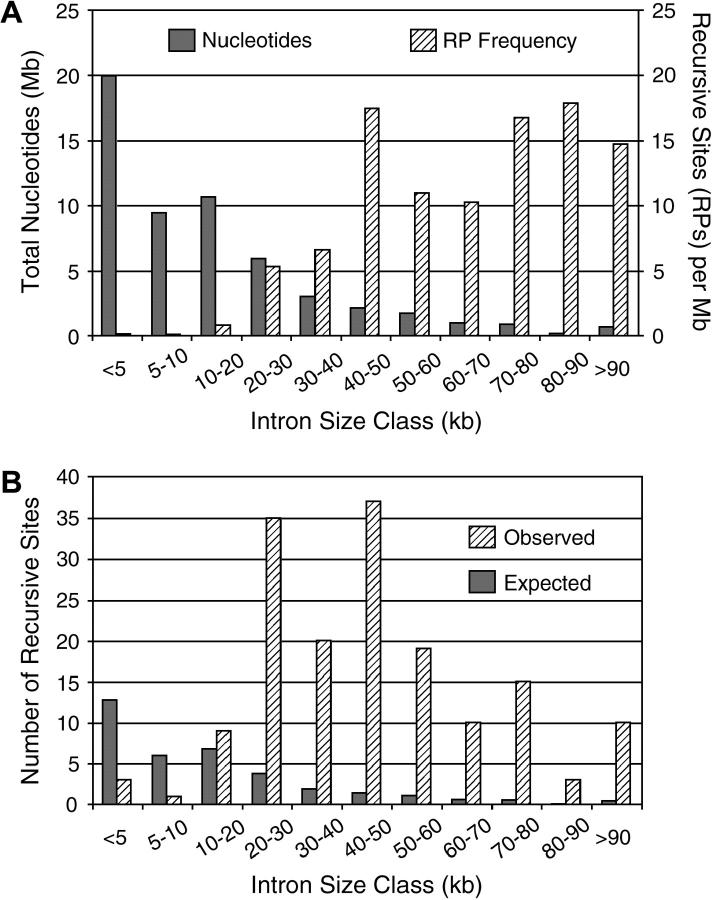
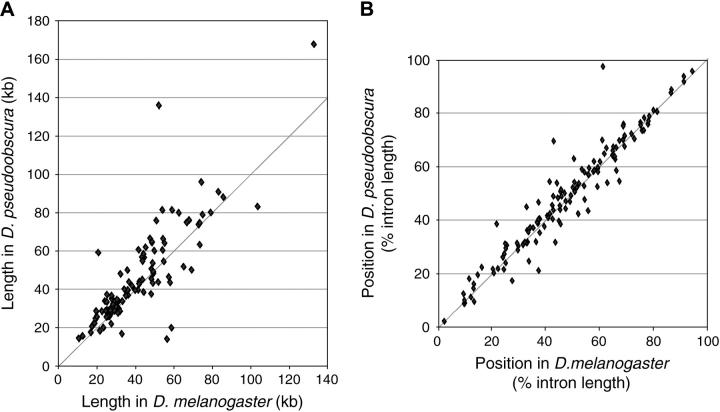
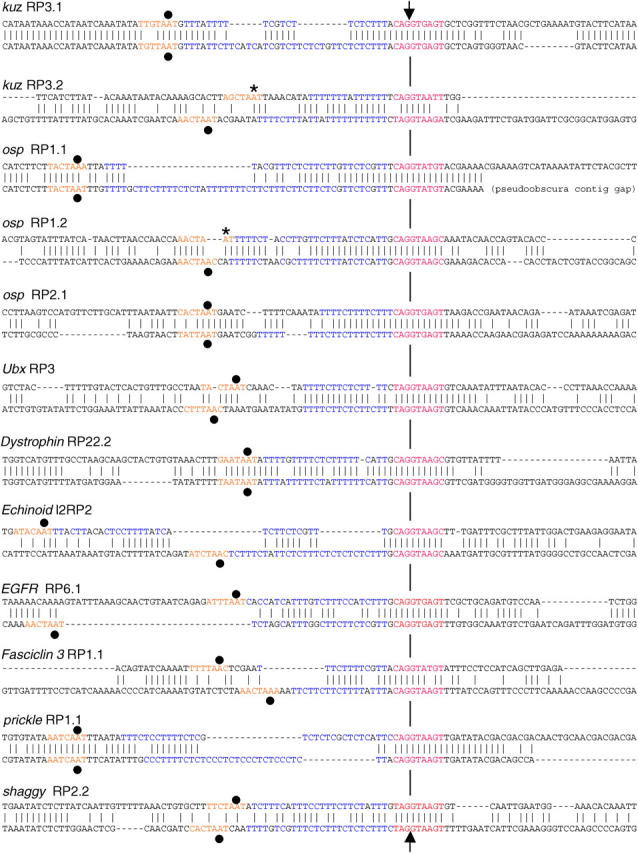
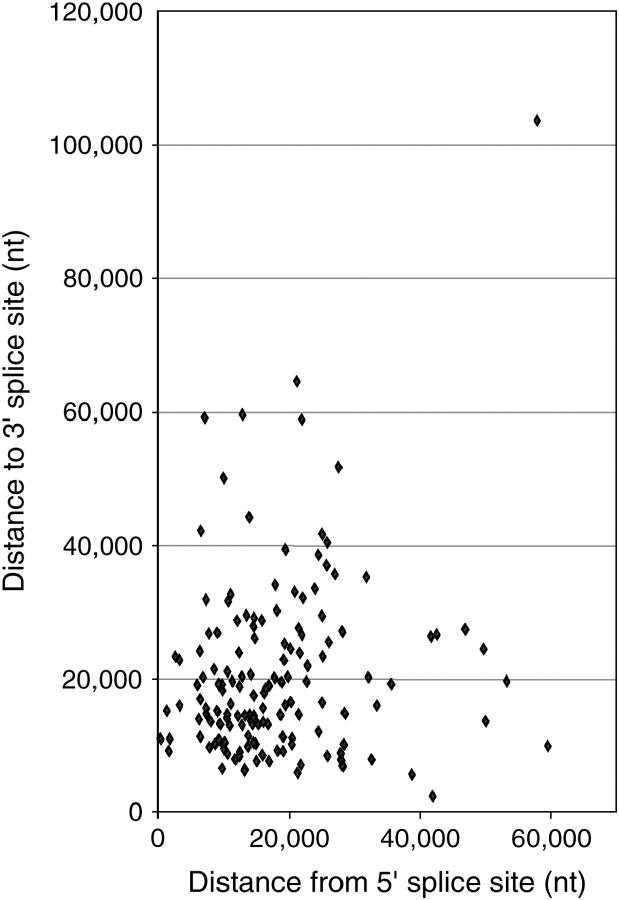
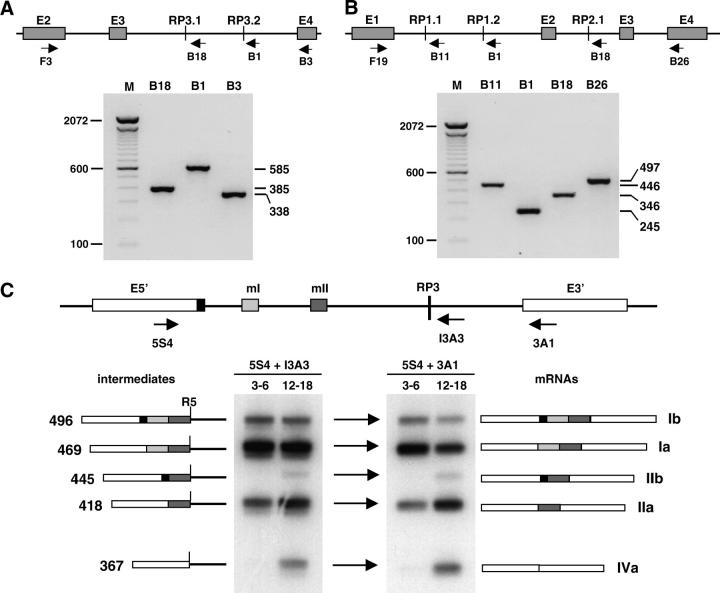
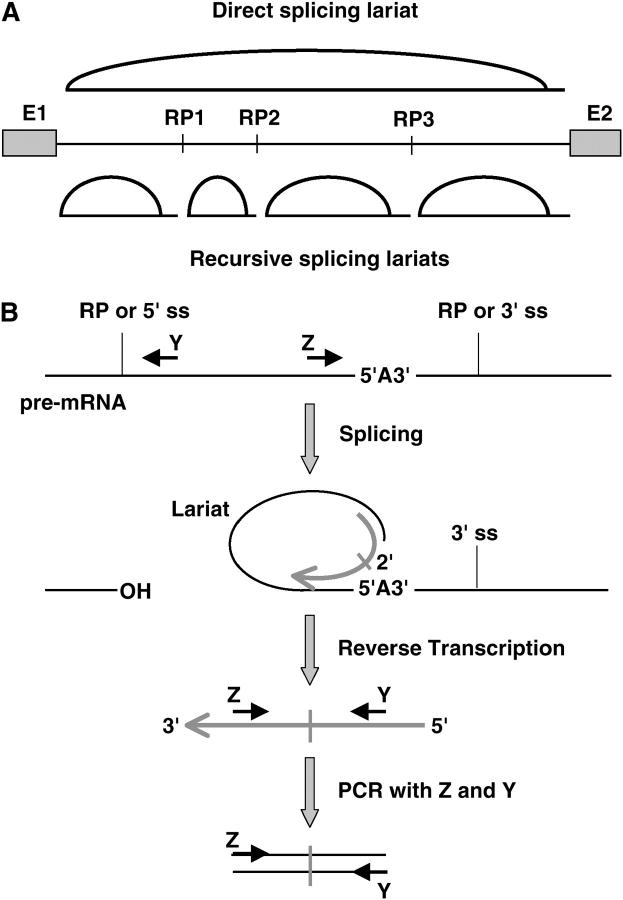
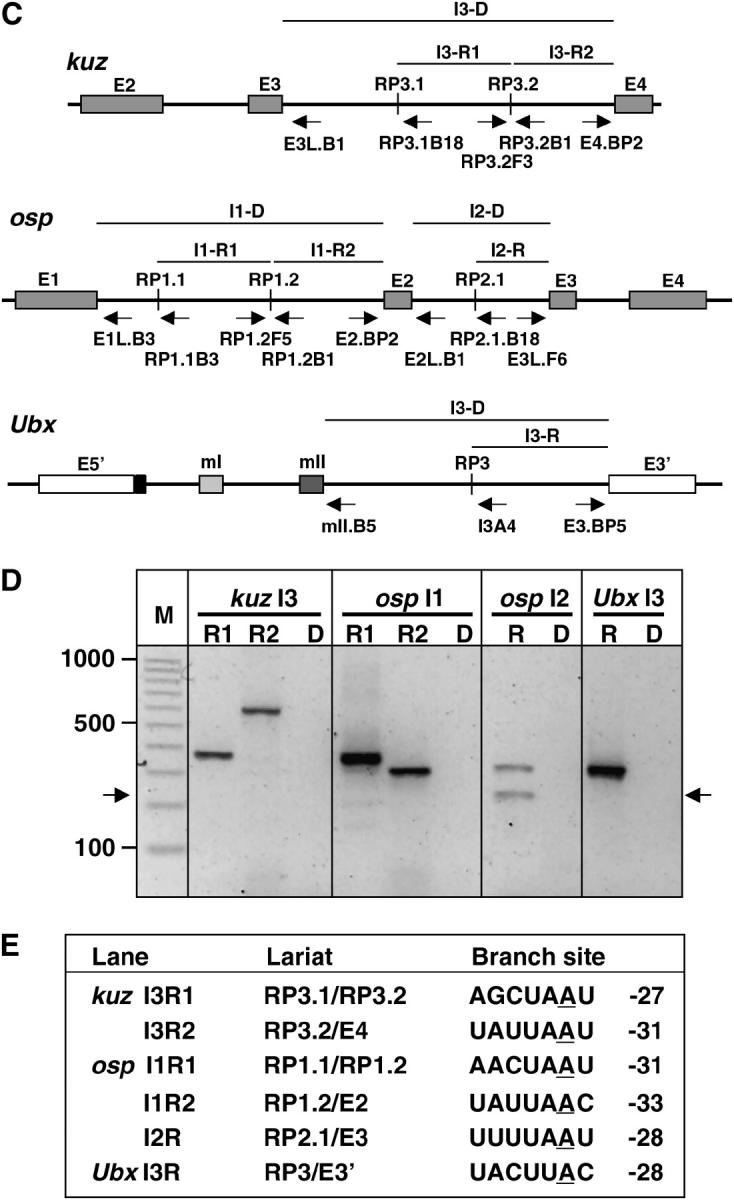
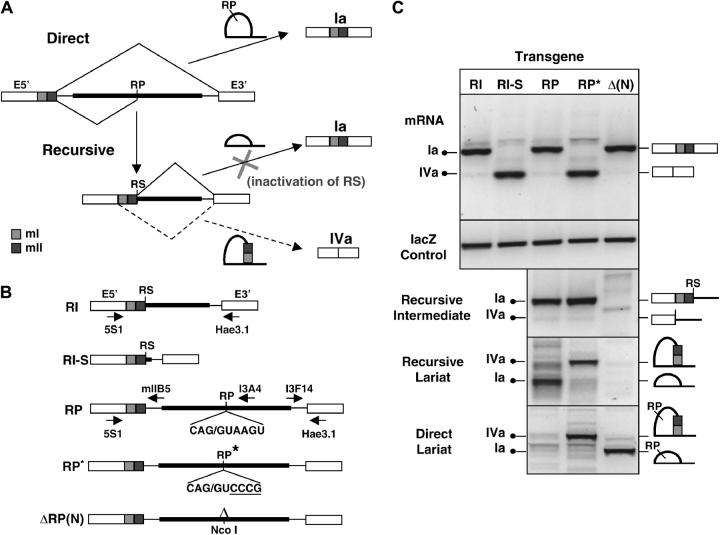
Many genes with important roles in development and disease contain exceptionally long introns, but special mechanisms for their expression have not been investigated. We present bioinformatic, phylogenetic, and experimental evidence in Drosophila for a mechanism that subdivides many large introns by recursive splicing at nonexonic elements and alternative exons. Recursive splice sites predicted with highly stringent criteria are found at much higher frequency than expected in the sense strands of introns >20 kb, but they are found only at the expected frequency on the antisense strands, and they are underrepresented within introns <10 kb. The predicted sites in long introns are highly conserved between Drosophila melanogaster and Drosophila pseudoobscura, despite extensive divergence of other sequences within the same introns. These patterns of enrichment and conservation indicate that recursive splice sites are advantageous in the context of long introns. Experimental analyses of in vivo processing intermediates and lariat products from four large introns in the unrelated genes kuzbanian, outspread, and Ultrabithorax confirmed that these introns are removed by a series of recursive splicing steps using the predicted nonexonic sites. Mutation of nonexonic site RP3 within Ultrabithorax also confirmed that recursive splicing is the predominant processing pathway even with a shortened version of the intron. We discuss currently known and potential roles for recursive splicing.


Figures

F<sc>igure</sc> 1.—
Figure 1.—
Recursive splicing. (A) Regeneration of 5′ splice sites. Previously identified recursive splice sites were part of cassette exons (dashed outlines); here we test the hypothesis of nonexonic sites. The overlapping 3′ and 5′ splice-site consensus sequences at the recursive splicing signal are overlined and underlined, respectively. M, A or C; Y, C or U. (B) Nucleotide frequency matrix used to identify potential recursive splice sites in Drosophila. The first row is the ideal sequence. The vertical line indicates the recursive splice site. Numbers indicate the frequencies (as a percentage) of each nucleotide at intron positions adjacent to the standard 3′ and 5′ splice sites (left and right of the vertical line, respectively).
F<sc>igure</sc> 2.—
Figure 2.—
Frequency and distribution of predicted recursive splice sites. (A) The total nucleotide content in each intron size class is plotted, along with the frequency of recursive splice sites in the same intron size classes. Although introns <20 kb account for most of the nucleotides, there is a strong and opposite bias in the distribution of recursive splice sites, which are found mostly in introns >20 kb. (B) Comparison of expected and observed occurrence of recursive splice sites. The expected numbers and distribution were calculated from the frequency expected if recursive splice-site signals occur at random. This frequency was estimated analytically and by Monte Carlo simulations as described in the text. The observed recursive splice sites occur at much higher frequency than expected overall and their distribution is skewed in two ways: they occur at lower-than-expected frequency in introns <10 kb and at greater-than-expected frequency in introns >20 kb.
F<sc>igure</sc> 3.—
Figure 3.—
Evolutionary conservation of predicted recursive splice sites in D. melanogaster and D. pseudoobscura. (A) Length comparison for introns that contain recursive splice sites predicted in D. melanogaster with a score ≥80. The exact length of each intron is given in supplementary Table S1 at http://www.genetics.org/supplemental/. (B) Conservation of position for recursive splice sites predicted in D. melanogaster with a score ≥80. Positions are indicated as a percentage of intron length, measured from the upstream exon-intron boundary. The exact location of each recursive splice site is given in supplementary Table S1 at http://www.genetics.org/supplemental/.
F<sc>igure</sc> 4.—
Figure 4.—
Examples of recursive splice-site conservation. Twelve representative examples are shown. The top 6 have been confirmed experimentally in this study (see results). The bottom 6 have not been tested, but are as good or better predictions as the confirmed sites. In each case the top sequence is from D. melanogaster, and the lower sequence is from D. pseudoobscura. A maximum of 112 nucleotides flanking each splice site are shown.Vertical ticks mark identical nucleotides, and horizontal dashes are gaps introduced to optimize the alignment. The arrows mark the point at which recursive splicing has been shown to occur (top 6 examples) or is predicted to occur (lower 6 examples). The hybrid 3′-ss/5′-ss sequence is shown in red; the polypyrimidine tract in blue; and the closest potential branch site in orange with the branchpoint nucleotide marked by a dot (if predicted) or an asterisk (if verified experimentally; see Figure 6). The score and location of each recursive splice site within the intron are shown in supplementary Table S1 at http://www.genetics.org/supplemental/. Note that the splice-site signals have been conserved despite extensive nucleotide substitutions, insertions, and deletions. The polypyrimidine tracts are generally longer than the search criteria require (see Figure 1), and conserved and verified sites include examples with the infrequent T at position +4 (osp RP1.1 and Fas3 RP1.1).
F<sc>igure</sc> 5.—
Figure 5.—
Spacing between predicted recursive splice sites. For each predicted recursive splice site in D. melanogaster, the distance to the subsequent 3′ splice site (exon or RP) is plotted against the distance from the preceding 5′ splice site (exon or RP). Both distances are measured in nucleotides. Descriptive statistics are given in the text.
F<sc>igure</sc> 6.—
Figure 6.—
Splicing of upstream exons to recursive splice sites. (A–C) RT-PCR analyses of recursive splicing intermediates and mRNAs below a diagram of the relevant exon/intron structures in the corresponding gene. In the diagrams, vertical lines represent recursive splice sites. Arrows indicate the positions of forward and reverse primers. In the gel figures, the reverse primers used are indicated above each lane. (A) kuzbanian and (B) outspread: amplimers were analyzed on agarose gels stained with GelStar. The expected size of each amplimer is indicated at the right, size markers at the left. The results shown are for RNA from embryos at 3–6 hr after egg laying (25°), but the same was observed at all embryonic and adult stages. The rightmost lane in each case is the final, completely spliced product: No cassette exons that might be associated with the recursive splice sites were detected at any stage. The mRNAs were amplified for 30 cycles, whereas the ratcheting intermediates were amplified for 35 cycles. (C) Ultrabithorax. The 32P end-labeled amplification products were analyzed on 8% acrylamide gels. The primers used and the developmental stage (hours after egg laying at 25°) are indicated above each lane. The sizes and structures of the alternative mRNA isoforms are labeled at the right. The corresponding recursive splicing intermediates are labeled at the left; R5 marks the 5′-ss regenerated at the junction with RP3. Cassette exons mI and mII are each 51 nt long. Exon E5′ has two alternative 5′ splice sites separated by 27 nt, giving rise to a and b variants of the mRNAs. The mRNAs and ratcheting intermediates were amplified for the same number of cycles, but the reaction sample loaded was 10 times greater for ratcheting intermediates than for mRNAs and the exposure was four times longer. The relative band intensities are thus consistent with accumulation of intermediates to ∼3% of mRNA levels. No additional cassette exon that might be associated with RP3 was detected at any other stage.
F<sc>igure</sc> 7.—
Figure 7.—
Lariat analysis of recursive splicing. (A) Rationale of lariat analysis. Direct splicing between the 5′-ss at the exon/intron boundary and the 3′-ss at the intron/exon boundary should generate a single lariat spanning the entire intron, with the 5′-ss ligated to the 2′-OH of the branchpoint nucleotide. In contrast, recursive splicing should generate a series of lariats, each spanning an intron subfragment. Although the activity of the recursively generated 5′ splice sites cannot be detected by direct analysis of spliced intermediates or mRNAs, each should be detected as a lariat in which the recursive 5′-ss is ligated to the branchpoint nucleotide of the next recursive splice site or exon. (B) RT-PCR strategy for lariat analysis. Reverse transcription was performed on total RNA using random hexamers or gene-specific primers. Subsequent PCR used gene-specific primers Y and Z, which prime convergently across the branch junction on lariat-derived cDNA. (C) Relevant gene structures. Flanking exons and recursive splice sites (vertical lines) are identified. Arrows indicate the position and orientation of primers used to detect the predicted recursive or direct splicing lariats. The horizontal lines above each gene diagram identify the intron segments whose removal corresponds to the recursive splicing lariats (designated R) or direct splicing lariats (designated D) being tested. The primers used in each test are the divergent primers at the extreme ends of the indicated segment (primer pairs are also identified in E). (D) Electrophoretic analysis of amplimers. The relevant splicing event is identified above each lane, as in C. R lanes are tests for recursive splicing lariats in 5′–3′ order for each intron. Lanes designated “D” are tests for direct splicing lariats of the same intron; all D amplimers were expected to be <800 bp. The M lane contains markers, with the size in base pairs shown at left. Arrows at left and right mark the true lariat band in lane osp I2 R1; sequencing revealed that the upper band in this lane is a novel circular splicing product in which the 5′-ss of osp exon 3 is joined to the 3′-ss of RP2.1. (E) Branch sites determined from sequence analysis of each amplimer. The branchpoint nucleotide is underlined; this was always an A in the genome but was replaced by T in the amplimers. The position of each branchpoint nucleotide is indicated relative to the 3′-ss. All lariat sequences revealed the predicted ligation of the recursive 5′-ss to the next branchpoint nucleotide. The branch sites conformed to the consensus for standard splicing.
F<sc>igure</sc> 8.—
Figure 8.—
Mutational analysis of recursive splicing mediated by Ubx RP3. (A) Rationale. The diagram shows the competing direct and recursive splicing pathways for the last intron fragment of Ubx. The junction between E5′ and mI is a consensus 5′ splice site whose activity removes mI and mII, thus producing mRNA IVa. In SL2 cells this activity is suppressed to low levels if the downstream 5′ splice site is functional. Production of isoform Ia by transcripts that enter the direct splicing pathway should not be affected by mutations that reduce the activity of the 5′ splice site that is regenerated by RP3 during recursive splicing. In contrast, such mutations should block further processing of transcripts that enter the recursive splicing pathway, thus reducing the yield of mRNA or causing a shift to use of the 5′-ss at the E5′/mI junction, which would produce isoform IVa instead of Ia. (B) Ubx minigene structures. Thin horizontal lines: contiguous intron sequences adjacent to mII and E3′. Thick horizontal lines: contiguous intron sequences flanking RP3. RS, regenerated 5′-ss at the mII/RP3 junction. RP, RP3. The wild-type and mutant sequences at RP3 are shown for Ubx.RP and Ubx.RP*; changes from wild type are underlined. In minigene ΔRP(N), an NcoI site replaces the RP3 sequence extending from the first nucleotide of the branch site through position +6 of the recursive splice site (see Figure 4). Arrows show the positions of primers used to detect spliced mRNAs (5S1 + Hae3.1), recursive intermediates (5S1 + I3A3), recursive lariats (I3A4 + I3F14), and direct lariats (mIIB5 + I3F14). (C) Splicing of minigene transcripts in SL2 cells. RT-PCR analysis of processed mRNAs is shown, together with the lacZ transfection control and the relevant intermediates and lariats. Amplimers were analyzed by electrophoresis through 2% agarose and staining with GelStar. Identical results were obtained in at least three independent experiments for each construct. The endogenous Ubx gene was not expressed at detectable levels in SL2 cells.

References

    1. Ares, M., L. Grate and M. H. Pauling, 1999. A handful of intron-containing genes produces the lion's share of yeast mRNA. RNA 9: 1138–1139. - PMC - PubMed
    1. Ashe, M. P., L. H. Pearson and N. J. Proudfoot, 1997. The HIV-1 5′ LTR poly(A) site is inactivated by U1 snRNP interaction with the downstream major splice donor site. EMBO J. 16: 5752–5763. - PMC - PubMed
    1. Berget, S. M., 1995. Exon recognition in vertebrate splicing. J. Biol. Chem. 270: 2411–2414. - PubMed
    1. Blencowe, B. J., 2000. Exonic splicing enhancers: mechanism of action, diversity and role in human genetic diseases. Trends Biochem. Sci. 25: 106–110. - PubMed
    1. Celniker, S. E., D. A. Wheeler, B. Kronmiller, J. W. Carlson, A. Halpern et al., 2002 Finishing a whole-genome shotgun: release 3 of the Drosophila melanogaster euchromatic genome sequence. Genome Biol. 3: research0079.1–0079.14. - PMC - PubMed

Publication types

MeSH terms