Comment
. 2005 Apr 1;308(5718):52; author reply 52.
doi: 10.1126/science.1108198.

Comment on "Oscillations in NF-kappaB signaling control the dynamics of gene expression"

Affiliations
Comment

Comment on "Oscillations in NF-kappaB signaling control the dynamics of gene expression"

Derren Barken et al. Science. .
No abstract available


Figures

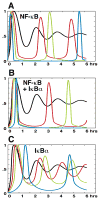
Fig. 1
Fig. 1
NF-κB activation profiles as a function of NF-κB protein levels. Relative (peak normalized) nuclear NF-κB activity graphed as a function of time in response to TNFα stimulation. Data derive from model simulations that reflect cells transfected with expression vectors described in (5) encoding (A) NF-κB-p65, (B) NF-κB-p65 and IκBα, and (C) IκBα. Expression of these proteins may result in protein levels that are normal (black) or increased 1.5-fold (red), 2-fold (green), or 4-fold (blue).
Fig. 2
Fig. 2
NF-κB activation in single cells. (A) Immunohistochemistry for endogenous NF-κB in NIH 3T3 cells (mouse fibroblasts) stimulated with TNFα. Cells were fixed and stained at 10 min, 30 min, 190 min, and 290 min after administration of TNFα and stained with an antibody to p65 (9). (B) Computational simulations of oscillatory NF-κB in IκBβ/ε-deficient cells that contain NF-κB protein levels that are “wild-type” (black), 1.2x (blue), or 0.8x (green). (C) The mean NF-κB activity (black line) produced by computational simulations of IκBβ/ε-deficient cells containing a distribution of NF-κB protein levels with a standard deviation of 10%. Red lines indicate the mean ±1 SD. (D) NF-κB localization data derived from immunohistological analysis graphed as nucleus:cytoplasm (N:C) ratio as a function of time in response to TNFα stimulation. Vertical bars indicate the standard deviation in the data for each time point. (E) Computational simulation of NF-κB activity in wild-type cells (6) in response to TNFα stimulation. Red lines indicate 1.2x and 0.8x NF-κB activity.
Fig. 3
Fig. 3
Target-gene expression in response to different NF-κB activity profiles. (A) NF-κB activity profiles in response to persistent TNFα stimulation in IκBβ−/−ε −/− (left) and IκBα−/−ε −/− (right) murine embryonic fibroblasts, as measured in (6). (B) mRNAs of known NF-κB response genes (10) were measured by RNAse protection assay at the indicated times during persistent TNFα stimulation.

Comment on

  • Oscillations in NF-kappaB signaling control the dynamics of gene expression.
    Nelson DE, Ihekwaba AE, Elliott M, Johnson JR, Gibney CA, Foreman BE, Nelson G, See V, Horton CA, Spiller DG, Edwards SW, McDowell HP, Unitt JF, Sullivan E, Grimley R, Benson N, Broomhead D, Kell DB, White MR. Nelson DE, et al. Science. 2004 Oct 22;306(5696):704-8. doi: 10.1126/science.1099962. Science. 2004. PMID: 15499023

References

    1. Jacquet M, Renault G, Lallet S, De Mey J, Goldbeter A. J Cell Biol. 2003;161:497. - PMC - PubMed
    1. Becskei A, Boselli MG, van Oudenaarden A. Nat Cell Biol. 2004;6:451. - PubMed
    1. Lev Bar-Or R, et al. Proc Natl Acad Sci USA. 2000;97:11250. - PMC - PubMed
    1. Lahav G, et al. Nat Genet. 2004;36:147. - PubMed
    1. Nelson DE, et al. Science. 2004;306:704. - PubMed

Publication types

LinkOut - more resources