Exuberant thalamocortical axon arborization in cortex-specific NMDAR1 knockout mice
- PMID: 15803506
- PMCID: PMC3560856
- DOI: 10.1002/cne.20481
Exuberant thalamocortical axon arborization in cortex-specific NMDAR1 knockout mice
Abstract
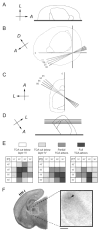
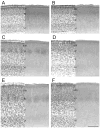
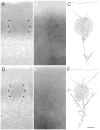
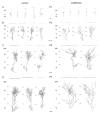
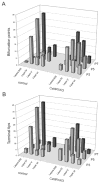
Development of whisker-specific neural patterns in the rodent somatosensory system requires NMDA receptor (NMDAR)-mediated activity. In cortex-specific NR1 knockout (CxNR1KO) mice, while thalamocortical afferents (TCAs) develop rudimentary whisker-specific patterns in the primary somatosensory (barrel) cortex, layer IV cells do not develop barrels or orient their dendrites towards TCAs. To determine the role of postsynaptic NMDARs in presynaptic afferent development and patterning in the barrel cortex, we examined the single TCA arbors in CxNR1KO mice between postnatal days (P) 1-7. Sparsely branched TCAs invade the cortical plate on P1 in CxNR1KO mice as in control mice. In control animals, TCAs progressively elaborate patchy terminals, mostly restricted to layer IV. In CxNR1KO mice, TCAs develop far more extensive arbors between P3-7. Their lateral extent is twice that of controls from P3 onwards. By P7, CxNR1KO TCAs have significantly fewer branch points and terminal endings in layers IV and VI but more in layers II/III and V than control mouse TCAs. Within expansive terminal arbors, CxNR1KO TCAs develop focal terminal densities in layer IV, corresponding to the rudimentary whisker-specific patches. Given that thalamic NMDARs are spared in CxNR1KO mice, the present results show that postsynaptic NMDARs play an important role in refinement of presynaptic afferent arbors and whisker-specific patterning in the developing barrel cortex.
(c) 2005 Wiley-Liss, Inc.
Figures



Similar articles
-
NMDA receptor-dependent pattern transfer from afferents to postsynaptic cells and dendritic differentiation in the barrel cortex.Mol Cell Neurosci. 2002 Nov;21(3):477-92. doi: 10.1006/mcne.2002.1195. Mol Cell Neurosci. 2002. PMID: 12498788 Free PMC article.
-
Lesion-induced thalamocortical axonal plasticity in the S1 cortex is independent of NMDA receptor function in excitatory cortical neurons.J Neurosci. 2002 Nov 1;22(21):9171-5. doi: 10.1523/JNEUROSCI.22-21-09171.2002. J Neurosci. 2002. PMID: 12417641 Free PMC article.
-
Refinement of thalamocortical arbors and emergence of barrel domains in the primary somatosensory cortex: a study of normal and monoamine oxidase a knock-out mice.J Neurosci. 2002 Oct 1;22(19):8541-52. doi: 10.1523/JNEUROSCI.22-19-08541.2002. J Neurosci. 2002. PMID: 12351728 Free PMC article.
-
The specificity of interactions between the cortex and the thalamus.Ciba Found Symp. 1995;193:173-91; discussion 192-9. doi: 10.1002/9780470514795.ch9. Ciba Found Symp. 1995. PMID: 8727492 Review.
-
Insights into the complex influence of 5-HT signaling on thalamocortical axonal system development.Eur J Neurosci. 2012 May;35(10):1563-72. doi: 10.1111/j.1460-9568.2012.8096.x. Eur J Neurosci. 2012. PMID: 22607002 Free PMC article. Review.
Cited by
-
Restoring transient connectivity during development improves dysfunctions in fragile X mice.bioRxiv [Preprint]. 2024 Sep 9:2024.09.08.611918. doi: 10.1101/2024.09.08.611918. bioRxiv. 2024. PMID: 39314327 Free PMC article. Preprint.
-
Glycine transporter-1 inhibition promotes striatal axon sprouting via NMDA receptors in dopamine neurons.J Neurosci. 2013 Oct 16;33(42):16778-89. doi: 10.1523/JNEUROSCI.3041-12.2013. J Neurosci. 2013. PMID: 24133278 Free PMC article.
-
Impact of thalamocortical input on barrel cortex development.Neuroscience. 2018 Jan 1;368:246-255. doi: 10.1016/j.neuroscience.2017.04.005. Epub 2017 Apr 13. Neuroscience. 2018. PMID: 28412498 Free PMC article. Review.
-
Insulin-Independent GABAA Receptor-Mediated Response in the Barrel Cortex of Mice with Impaired Met Activity.J Neurosci. 2016 Mar 30;36(13):3691-7. doi: 10.1523/JNEUROSCI.0006-16.2016. J Neurosci. 2016. PMID: 27030755 Free PMC article.
-
Development of the principal nucleus trigeminal lemniscal projections in the mouse.J Comp Neurol. 2013 Feb 1;521(2):299-311. doi: 10.1002/cne.23183. J Comp Neurol. 2013. PMID: 22791623 Free PMC article.
References
-
- Agmon A, Connors BW. Thalamocortical responses of mouse somatosensory (barrel) cortex in vitro. Neuroscience. 1991;41:365–379. - PubMed
-
- Anderson SA, Eisenstat DD, Shi L, Rubensterin JLR. Interneuron migration from basal forebrain to neocortex: dependence on Dlx genes. Science. 1997;278:474–476. - PubMed
-
- Carroll RC, Zukin RS. NMDA-receptor trafficking and targeting: implications for synaptic transmission and plasticity. Trends Neurosci. 2002;25:571–577. - PubMed
Publication types
MeSH terms
Substances
Grants and funding
LinkOut - more resources
Full Text Sources
Molecular Biology Databases

