. 2002 Mar;1(1):35-44.
doi: 10.1155/2002/419261.

Common evolutionary origins of mechanosensitive ion channels in Archaea, Bacteria and cell-walled Eukarya

Affiliations

Common evolutionary origins of mechanosensitive ion channels in Archaea, Bacteria and cell-walled Eukarya

Anna Kloda et al. Archaea. 2002 Mar.

Abstract

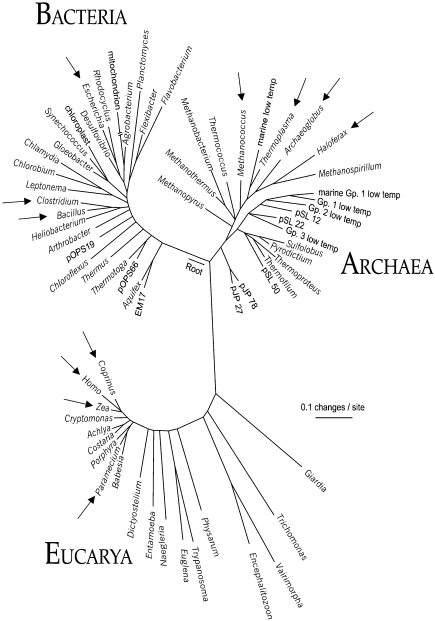
The ubiquity of mechanosensitive (MS) channels triggered a search for their functional homologs in Archaea. Archaeal MS channels were found to share a common ancestral origin with bacterial MS channels of large and small conductance, and sequence homology with several proteins that most likely function as MS ion channels in prokaryotic and eukaryotic cell-walled organisms. Although bacterial and archaeal MS channels differ in conductive and mechanosensitive properties, they share similar gating mechanisms triggered by mechanical force transmitted via the lipid bilayer. In this review, we suggest that MS channels of Archaea can bridge the evolutionary gap between bacterial and eukaryotic MS channels, and that MS channels of Bacteria, Archaea and cell-walled Eukarya may serve similar physiological functions and may have evolved to protect the fragile cellular membranes in these organisms from excessive dilation and rupture upon osmotic challenge.


Figures

Figure 1.
Figure 1.
Universal phylogenetic tree based on small subunit rRNA sequences (modified from Pace 1997, with permission). Organisms in each of the three domains in which MS channel activities have been documented by structure or function are marked with arrows.
Figure 2.
Figure 2.
Multiplicity of MS channels in bacteria and archaea. Current traces (pA) of Escherichia coli MscL and MscS are followed by traces of MscA1 and MscA2 of Haloferax volcanii and MscMJ and MscMJLR of Methanococcus jannaschii. The bottom trace shows the activity of MscTA, the MS channel of Thermoplasma acidophilum. Single channel currents were recorded at +40 mV. Abbreviations: C denotes the closed state; O denotes the open state; and O1, O2 and O3 denote the open state of 1, 2 and 3 channels, respectively. Note: 1 mmHg = 133 Pa.
Figure 3.
Figure 3.
Comparison of conductive properties of bacterial and archaeal MS channels. From top to bottom: MscA1 and MscA2 of Haloferax volcanii (adapted from Le Dain et al. 1998); MscMJ and MscMJLR of Methanococcus jannaschii (adapted from Kloda and Martinac 2001b); MscL and MscS of Escherichia coli; and MscTA of Thermoplasma acidophilum (adapted from Kloda and Martinac 2001c). Current–voltage plots were obtained in a symmetric recording solution of 200 mM KCl, 5 mM MgCl2, 5 mM HEPES, pH 7.2, from data where the voltage was stepped to the given potential, except for the MscA1 and MscA2 single-channel currents, which were obtained for a voltage ramp from –60 to +60 mV over 2.6 and 1.7 s, respectively.
Figure 4.
Figure 4.
Boltzmann distribution curves for MS channels in prokaryotes. (A) MscS and MscL of Escherichia coli; based on Martinac (unpublished data) and Kloda and Martinac (2001d). (B) MscA1 and MscA2 of Haloferax volcanii; adapted from LeDain et al. (1998). (C) MscMJ and MscMJLR of Methanococcus jannaschii; adapted from Kloda and Martinac (2001a, 2001b). (D) MscTA of Thermoplasma acidophilum; based on Kloda and Martinac (2001c). The Boltzmann function for MS channels relates applied negative pressure and open probability (Po) fitted by nonlinear regression and has the form: Po/(1 – Po) = exp(α(pp1/2)), where p1/2 is the pressure required for a channel open probability of 50% and α is the slope of the plot of ln(Po/(1 – Po)) versus negative pressure and describes the pressure sensitivity of the channels in the particular patch. Values for Boltzmann parameters are given in Table 1. Note: 1 mmHg = 133 Pa.
Figure 5.
Figure 5.
Diagram of the MscL pentamer from Mycobacterium tuberculosis according to the three-dimensional structural model proposed by Chang et al. (1998). The pentamer (left) and a single monomer (right) are shown. The transmembrane helices TM1 and TM2 are labeled. Solid blocks denote the location of the membrane interface with the periplasmic and cytoplasmic spaces. This figure was produced by MolScript (Avatar Software, Stockholm, Sweden; Kraulis 1991) (adapted from Oakley et al. 1999).
Figure 6.
Figure 6.
(A) Phylogenetic tree of complete aligned sequences of MscL and MscMJ homologs showing the common ancestry of prokaryotic MS channels. The archaeal homologs of MscMJ are highlighted in red. (B) Phylogenetic tree of complete aligned sequences of MscMJ and MscMJLR homologs showing the family relationship between bacterial and archaeal MS channels, and putative MS channels in A. thaliana and S. pombe. The bacterial MS channel homologs of MscMJ and MscMJLR are depicted in black; archaeal MS homologs are highlighted in red; and plant and yeast homologs are highlighted in green. The TM1 domain of E. coli MscL was used as a genetic probe to search the M. jannaschii genomic database for sequence similarity, leading to identification of MscMJ. Homologs of MscMJ and MscL were retrieved from the existing protein databases (GenBank, Protein DataBank and SwissProt) using BLAST (Altschul et al. 1997). Multiple alignment of entire sequences was performed using the CLUSTAL X program (Thompson et al. 1997). The phylogenetic trees of prokaryotic MscL and MscMJ-like homologs are shown to ensure the best sequence alignment of known and hypothetical MS channel proteins. Note that there are common members in both trees, suggesting a common ancestry. Bootstrap Neighbor-Joining Trees with 1000 bootstrap trials each were viewed with the TreeView program. Bootstrap values are given on the branch nodes.
Figure 7.
Figure 7.
Helical wheel representation of the TM1 domains of MscMJLR and MscMJ from Methanococcus jannaschii and of MscL from Escherichia coli. Charged residues are boxed and the start of each helix is marked with an asterisk. Arrows indicate positions at which hydrophobic residues within the TM1 helix of MscMJLR are replaced with hydrophilic (charged) residues in the MscMJ helix. Note that the TM1 domains of MscMJ and MscMJLR are hypothetical. Adapted from Kloda and Martinac (2001b).

References

    1. Ajouz B., Berrier C., Garrigues A., Besnard M., Ghazi A. Release of thioredoxin via mechanosensitive channel MscL during osmotic downshock of Escherichia coli cells. J. Biol. Chem. 1998;273:26670–26674. - PubMed
    1. Ajouz B., Berrier C., Besnard M., Martinac B., Ghazi A. Contributions of the different extramembraneous domains of the mechanosensitive ion channel MscL to its response to membrane tension. J. Biol. Chem. 2000;275:1015–1022. - PubMed
    1. Altschul S.F., Madden T., Schaffer A., Zhang J., Zhang Z., Miller W., Lipman D. Gapped BLAST and PSI-BLAST: a new generation of protein database search programs. Nucleic Acids Res. 1997;25:3389–3402. - PMC - PubMed
    1. Alvarez O., Latorre R. Voltage-dependent capacitance in liquid bilayers made from monolayers. Biophys. J. 1978;21:1–17. - PMC - PubMed
    1. Barinaga M. Molecular evolution. Archaea and eukaryotes grow closer. Science. 1994;264:1251. - PubMed

LinkOut - more resources