. 2005 Apr 1:6:48.
doi: 10.1186/1471-2164-6-48.

Identification and characterization of a novel mammalian Mg2+ transporter with channel-like properties

Affiliations

Identification and characterization of a novel mammalian Mg2+ transporter with channel-like properties

Angela Goytain et al. BMC Genomics. .

Abstract

Background: Intracellular magnesium is abundant, highly regulated and plays an important role in biochemical functions. Despite the extensive evidence for unique mammalian Mg2+ transporters, few proteins have been biochemically identified to date that fulfill this role. We have shown that epithelial magnesium conservation is controlled, in part, by differential gene expression leading to regulation of Mg2+ transport. We used this knowledge to identify a novel gene that is regulated by magnesium.

Results: Oligonucleotide microarray analysis was used to identify a novel human gene that encodes a protein involved with Mg2+-evoked transport. We have designated this magnesium transporter (MagT1) protein. MagT1 is a novel protein with no amino acid sequence identity to other known transporters. The corresponding cDNA comprises an open reading frame of 1005 base pairs encoding a protein of 335 amino acids. It possesses five putative transmembrane (TM) regions with a cleavage site, a N-glycosylation site, and a number of phosphorylation sites. Based on Northern analysis of mouse tissues, a 2.4 kilobase transcript is present in many tissues. When expressed in Xenopus laevis oocytes, MagT1 mediates saturable Mg2+ uptake with a Michaelis constant of 0.23 mM. Transport of Mg2+ by MagT1 is rheogenic, voltage-dependent, does not display any time-dependent inactivation. Transport is very specific to Mg2+ as other divalent cations did not evoke currents. Large external concentrations of some cations inhibited Mg2+ transport (Ni2+, Zn2+, Mn2+) in MagT1-expressing oocytes. Ca2+and Fe2+ were without effect. Real-time reverse transcription polymerase chain reaction and Western blot analysis using a specific antibody demonstrated that MagT1 mRNA and protein is increased by about 2.1-fold and 32%, respectively, in kidney epithelial cells cultured in low magnesium media relative to normal media and in kidney cortex of mice maintained on low magnesium diets compared to those animals consuming normal diets. Accordingly, it is apparent that an increase in mRNA levels is translated into higher protein expression.

Conclusion: These studies suggest that MagT1 may provide a selective and regulated pathway for Mg2+ transport in epithelial cells.


Figures

Figure 1
Figure 1
Primary amino acid sequence of human hMagT1. Human MagT1 was aligned with human candidate tumor suppressor sequence, N33, and the human implantation associated protein, designated IAP. The six predicted transmembrane domains are overlined and numbered. The amino acid numbers corresponding to the MagT1 protein are shown on the left side.
Figure 2
Figure 2
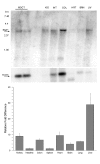
Tissue distribution of mMagT1 mRNA. A, Northern blot analysis of mMagT1 mRNA in MDCT cells or mouse tissues. Tissues were harvested and poly(A)+ RNA prepared by standard techniques. Each lane was loaded with 8 µg of poly(A)+ RNA. The same blot was stripped and hybridized with 32P-labeled β-actin as a control for loading. B, real-time reverse transcription PCR analysis of mMagT1 RNA in tissues harvested from mice maintained on normal magnesium diet. mMagT1 and murine β-actin RNA was measured with Real-Time RT PCR (AB7000TM, Applied Biosystems) using SYBR GreenTM fluorescence. Standard curves for MagT1 and β-actin were generated by serial dilution of each plasmid DNA. The expression level of the mMagT1 transcript was normalized to that of the mouse β-actin transcript measured in the same 1.0 μg RNA sample. Results are normalized to the small intestine and expressed as fold-difference. Mean mRNA levels of kidney, colon, heart, brain, lung, and liver tissues were significantly greater, p>0.01, than small intestine ans spleen.
Figure 3
Figure 3
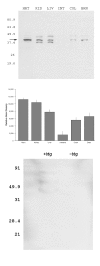
Tissue distribution of mMagT1 protein. A. Western blots of membrane proteins from tissue extracts. Extracts were prepared from tissues as described under “Experimental Procedures”. MagT1 bands were probed with anti-MagT1antibody. Molecular sizes are expressed in kDa of pre-stained standards are shown on the left of each of the representative blots. B, summary of 38 kDa MagT1 protein in 15 μg total protein from various mice tissues. Data were obtained from 3 different mice and are indicated as the mean ± SEM. C, specificity of anti-MagT1 antibody. The fractions isolated from normal and magnesium-depleted MDCT cells were blotted with MagT1 antibody and MagT1 antibody preadsorbed with excess antigen peptide. The signal was reduced to background levels when preadsorbed antibody was used indicating that the antibody was specific to MagT1.
Figure 4
Figure 4
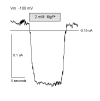
Mg2+-evoked currents in Xenopus oocytes expressing hMagT1 RNA transcripts. Current was continuously monitored in a single oocyte expressing hMagT1 clamped at -100 mV and superfused for the period indicated, first with modified Barth’s solution containing 0 mM magnesium then with 2.0 mM magnesium and finally returning to magnesium-free solution.
Figure 5
Figure 5
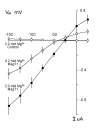
Mg2+-evoked currents in Xenopus oocytes expressing hMagT1. Current-voltage relationships obtained from linear voltage steps from -150 mV to +25 mV in the presence of Mg2+-free solutions or those containing the indicated concentrations of MgCl2. Oocytes were clamped at a holding potential of -15 mV and stepped from -150 mV to +25 mV in 25 mV increments for 2 s at each of the concentrations indicated. Shown are average I-V curves obtained from control H2O-injected (n = 13) or MagT1-expressing (n =/>7) oocytes. Note, the positive shift in reversal potential, indicated by arrows, with increments in magnesium concentration. Values are mean ± SEM of observations measured at the end of each voltage sweep for the respective Mg2+ concentration.
Figure 6
Figure 6
Association of Mg2+ currents with the expression of 38 kDa MagT1 protein in Xenopus oocytes injected with MagT1 cRNA. Oocytes were selected from one frog according to the expressed Mg2+ currents as shown. Results illustrated is representative of four oocyte preparations from different animals. The relative amplitude of Mg2+ currents was associated with the amount of MagT1 protein determined by Western blot analysis.
Figure 7
Figure 7
Summary of concentration-dependent Mg2+-evoked currents in MagT1-expressing oocytes using a holding potential of -125 mV. Mean ± SEM values are those given in Fig. 1A. Inset illustrates an Eadie-Hofstee plot of concentration-dependent Mg2+-evoked currents demonstrating a Michaelis constant of 0.23 mM.
Figure 8
Figure 8
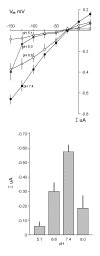
Characterization of Mg2+-evoked currents in Xenopus oocytes expressing hMagT1. A, effect of pH on Mg2+-evoked currents. Currents were measured in standard solutions containing 2.0 mM MgCl2 at the pH values indicated. B, summary of mean currents with external pH at a holding potential of -125 mV. Mg2+ did not evoke currents in H2O-injected oocytes at any of the pH values tested.
Figure 9
Figure 9
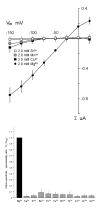
Substrate specificity of MagT1 following application of test cations, 2.0 mM, in the absence of external Mg2+. For clarity, only Mg2+,Cu2+, Mn2+, and Sr2+ are represented in panel A. Oocytes were clamped at a holding potential of -15 mV and stepped from -150 mV to +25 mV in 25 mV increments for 2 s for each of the cations. Values are mean ± SEM of currents measured at the end of each voltage sweep for the respective divalent cation. B, summary of permeabilities of the tested divalent cations. Figure illustrates average permeability ratios (Erev for tested cation relative to Erev for Mg2+) given in Fig. 9A.
Figure 10
Figure 10
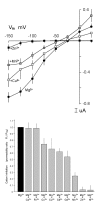
Inhibition of MagT1-mediated currents. A,inhibition of Mg2+-evoked currents with 0.2 mM test cation in the presence of external 2.0 mM Mg2+. For clarity, only Cu2+, Mn3+, and Zn2+ relative to Mg2+ are represented. Values are mean ± SEM of currents measured at the end of each voltage sweep for the respective cation. B, summary of inhibition by multivalent cations of Mg2+ currents based on the change in Erev represented in Fig. 10A. The inhibitor was added with MgCl2 and voltage-clamp was performed about 5 min later.
Figure 11
Figure 11
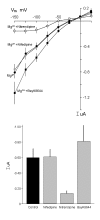
Effect of voltage-dependent channel antagonists on MagT1-mediated currents. A, the antagonists nifedipine (10 µM) and nitrendipine (10 µM), or the agonist, Bay K8644 (10 µM), were added prior to determining Mg2+-evoked currents. B, summary of mean currents (I µA) with the respective inhibitors at a holding potential (Vm) of -125 mV (n=7). The analogues were added 5 min prior to voltage-clamping.
Figure 12
Figure 12
MagT1 mRNA expression is responsive to magnesium. Where indicated MDCT cells were cultured in normal (1.0 mM) or low (<0.01 mM) magnesium media for 16 h. Kidney cortical tissue was harvested from mice on normal (0.05% by weight) or low magnesium (<0.01%) diets for 5 days. MagT1 and murine β-actin RNA was measured with Real-Time RT PCR (AB7000TM, Applied Biosystems) using SYBR GreenTM fluorescence. Data is from 10-12 PCRs performed on five separate cultures or animals in each group maintained on low and normal magnesium.
Figure 13
Figure 13
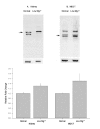
MagT1 protein expression is responsive to magnesium. Western blots of membrane proteins from cells and tissues as described under “Experimental Procedures”. MagT1 bands were probed with anti-MagT1antibody. Data are from four Western blots performed on five separate cultures or animals in each group maintained on low and normal magnesium.

References

    1. Flatman PW. Magnesium transport across cell membranes. J Membr Biol. 1984;80:1–14. - PubMed
    1. Quamme GA. Renal magnesium handling: New insights in understanding old problems. Kidney Int. 1997;52:1180–1195. - PubMed
    1. Cole DEC, Quamme GA. Inherited disorders of renal magnesium handling. J Am Soc Nephrol. 2000;11:1937–1947. - PubMed
    1. Bui DM, Gregan J, Jarosch E, Ragnini A, Schweyen RJ. The bacterial magnesium transporter CorA can functionally substitute for its putative homologue Mrs2p in the yeast inner mitochondrial membrane. J Biol Chem. 1999;274:20438–20443. doi: 10.1074/jbc.274.29.20438. - DOI - PubMed
    1. Zsurka G, Gregan J, Schweyen RJ. The human mitochondrial Mrs2 protein functionally substitutes for its yeast homologue, a candidate magnesium transporter. Genomics. 2001;72:158–168. doi: 10.1006/geno.2000.6407. - DOI - PubMed

Publication types

MeSH terms