

Plakoglobin suppresses keratinocyte motility through both cell-cell adhesion-dependent and -independent mechanisms
- PMID: 15805189
- PMCID: PMC556221
- DOI: 10.1073/pnas.0501676102
Plakoglobin suppresses keratinocyte motility through both cell-cell adhesion-dependent and -independent mechanisms
Abstract
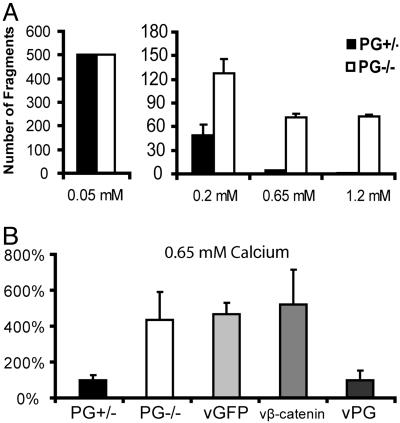
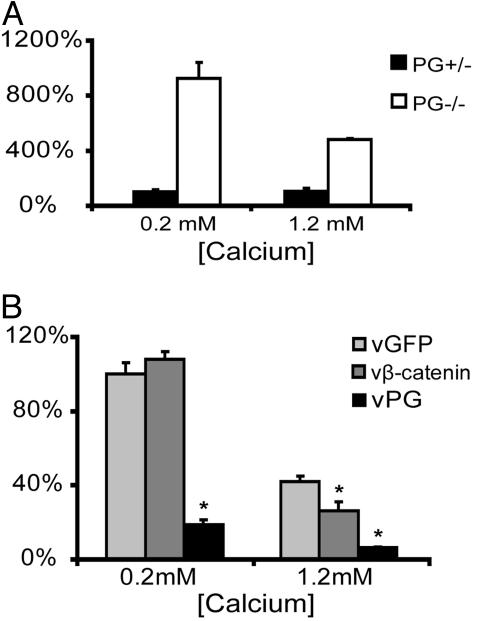
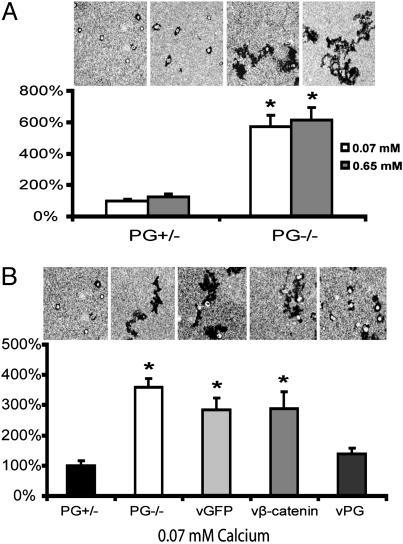
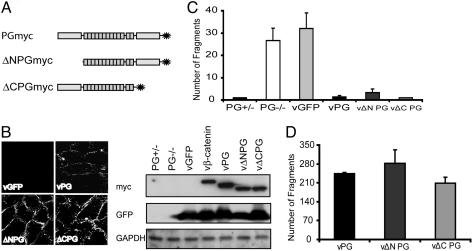
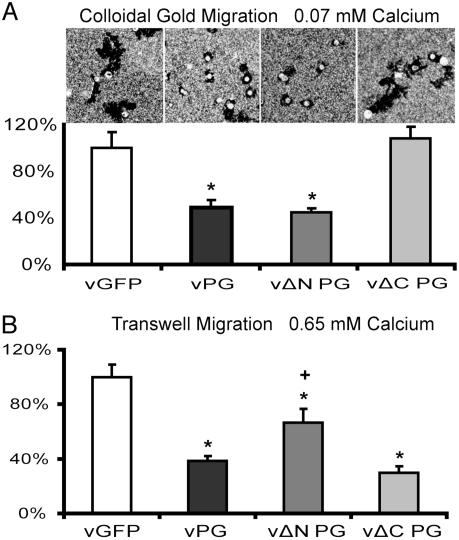
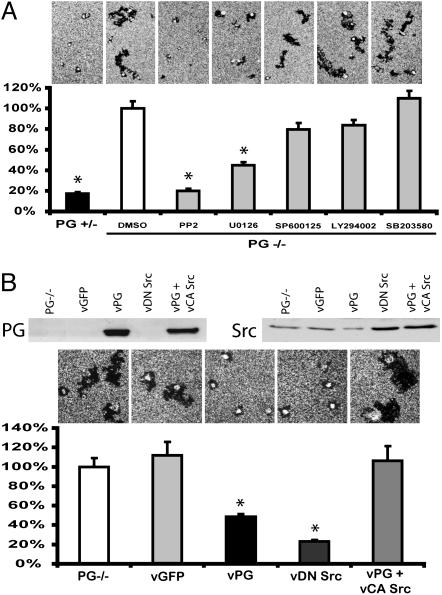
Plakoglobin (PG) is a member of the Armadillo family of adhesion/signaling proteins and has been shown to play a critical role in the organization of desmosomes and tissue integrity. Because dissolution of intercellular junctions is frequently an initial step in the onset of epithelial cell migration, we examined whether loss of PG promotes cell motility by compromising adhesive strength. Keratinocyte cultures established from PG-/-mice exhibited weakened adhesion and increased motility in transwell migration assays; both were restored by reintroducing PG through adenoviral infection. Interestingly, single PG-/- cells also exhibited increased motility, which was suppressed by reintroducing PG, but not the closely related beta-catenin. Whereas both N- and C-terminally truncated PG deletion mutants restored adhesion, only N-terminally deleted PG, but not C-terminally deleted PG, suppressed single-cell migration. Furthermore, both the chemical inhibitor PP2 and dominant-negative Src tyrosine kinase inhibited single-cell motility in PG-/- cells, whereas constitutively active Src overcame the inhibitory effect of PG. These data demonstrate that PG strengthens adhesion and suppresses motility in mouse keratinocytes, through both intercellular adhesion-dependent and -independent mechanisms, the latter of which may involve suppression of Src signaling through a mechanism requiring the PG C terminus.
Figures
Similar articles
-
A central role for the armadillo protein plakoglobin in the autoimmune disease pemphigus vulgaris.J Cell Biol. 2001 May 14;153(4):823-34. doi: 10.1083/jcb.153.4.823. J Cell Biol. 2001. PMID: 11352942 Free PMC article.
-
Tyrosine phosphorylation and src family kinases control keratinocyte cell-cell adhesion.J Cell Biol. 1998 Jun 15;141(6):1449-65. doi: 10.1083/jcb.141.6.1449. J Cell Biol. 1998. PMID: 9628900 Free PMC article.
-
Mechanisms of plakoglobin-dependent adhesion: desmosome-specific functions in assembly and regulation by epidermal growth factor receptor.J Biol Chem. 2005 Dec 2;280(48):40355-63. doi: 10.1074/jbc.M506692200. Epub 2005 Sep 23. J Biol Chem. 2005. PMID: 16183992
-
Fyn tyrosine kinase is a downstream mediator of Rho/PRK2 function in keratinocyte cell-cell adhesion.J Cell Biol. 2002 Jan 7;156(1):137-48. doi: 10.1083/jcb.200105140. Epub 2002 Jan 3. J Cell Biol. 2002. PMID: 11777936 Free PMC article.
-
Regulation of desmosome assembly and adhesion.Semin Cell Dev Biol. 2004 Dec;15(6):665-77. doi: 10.1016/j.semcdb.2004.09.005. Semin Cell Dev Biol. 2004. PMID: 15561586 Review.
Cited by
-
Plakoglobin as a regulator of desmocollin gene expression.J Invest Dermatol. 2013 Dec;133(12):2732-2740. doi: 10.1038/jid.2013.220. Epub 2013 May 7. J Invest Dermatol. 2013. PMID: 23652796 Free PMC article.
-
Desmosome regulation and signaling in disease.Cell Tissue Res. 2015 Jun;360(3):501-12. doi: 10.1007/s00441-015-2136-5. Epub 2015 Feb 19. Cell Tissue Res. 2015. PMID: 25693896 Free PMC article. Review.
-
Cell-cell contact preserves cell viability via plakoglobin.PLoS One. 2011;6(10):e27064. doi: 10.1371/journal.pone.0027064. Epub 2011 Oct 28. PLoS One. 2011. PMID: 22046445 Free PMC article.
-
EBV latent membrane protein 1 effects on plakoglobin, cell growth, and migration.Cancer Res. 2008 Sep 1;68(17):6997-7005. doi: 10.1158/0008-5472.CAN-08-1178. Cancer Res. 2008. PMID: 18757414 Free PMC article.
-
The desmosomal armadillo protein plakoglobin regulates prostate cancer cell adhesion and motility through vitronectin-dependent Src signaling.PLoS One. 2012;7(7):e42132. doi: 10.1371/journal.pone.0042132. Epub 2012 Jul 30. PLoS One. 2012. PMID: 22860065 Free PMC article.
References
-
- Zhurinsky, J., Shtutman, M. & Ben-Ze'ev, A. (2000) J. Cell Sci. 113, 3127–3139. - PubMed
-
- Solanas, G., Miravet, S., Casagolda, D., Castano, J., Raurell, I., Corrionero, A., de Herreros, A. G. & Dunach, M. (2004) J. Biol. Chem. 279, 49849–49856. - PubMed
-
- Cowin, P., Kapprell, H. P., Franke, W. W., Tamkun, J. & Hynes, R. O. (1986) Cell 46, 1063–1073. - PubMed
-
- Bierkamp, C., McLaughlin, K. J., Schwarz, H., Huber, O. & Kemler, R. (1996) Dev. Biol. 180, 780–785. - PubMed
Publication types
MeSH terms
Substances
Grants and funding
LinkOut - more resources
Full Text Sources
Molecular Biology Databases
Miscellaneous
