. 2005 Apr 12;102(15):5374-9.
doi: 10.1073/pnas.0501652102. Epub 2005 Apr 1.

Decreased plasma cholesterol and hypersensitivity to statins in mice lacking Pcsk9

Affiliations

Decreased plasma cholesterol and hypersensitivity to statins in mice lacking Pcsk9

Shirya Rashid et al. Proc Natl Acad Sci U S A. .

Abstract

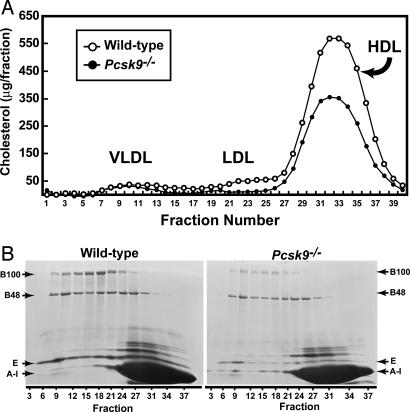
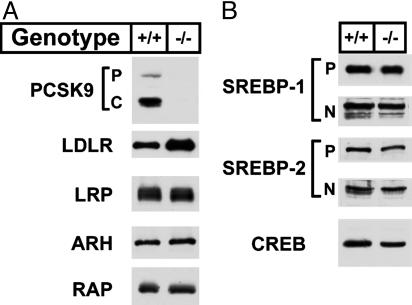
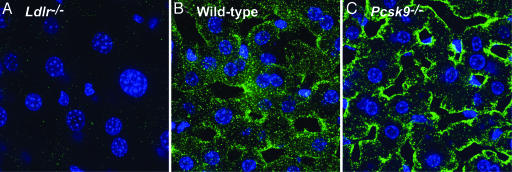
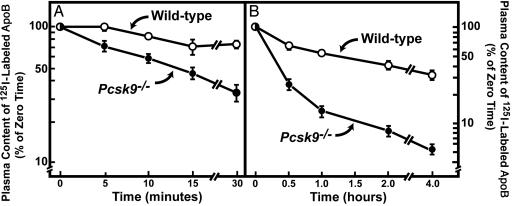
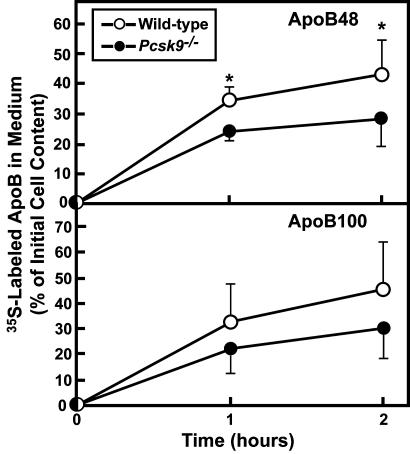
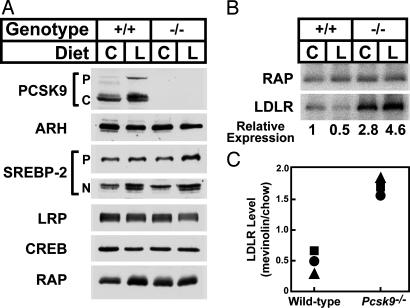
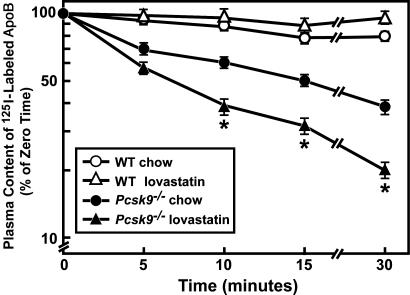
PCSK9 encodes proprotein convertase subtilisin/kexin type 9a (PCSK9), a member of the proteinase K subfamily of subtilases. Missense mutations in PCSK9 cause an autosomal dominant form of hypercholesterolemia in humans, likely due to a gain-of-function mechanism because overexpression of either WT or mutant PCSK9 reduces hepatic LDL receptor protein (LDLR) in mice. Here, we show that livers of knockout mice lacking PCSK9 manifest increased LDLR protein but not mRNA. Increased LDLR protein led to increased clearance of circulating lipoproteins and decreased plasma cholesterol levels (46 mg/dl in Pcsk9(-/-) mice versus 96 mg/dl in WT mice). Statins, a class of drugs that inhibit cholesterol synthesis, increase expression of sterol regulatory element-binding protein-2 (SREBP-2), a transcription factor that activates both the Ldlr and Pcsk9 genes. Statin administration to Pcsk9(-/-) mice produced an exaggerated increase in LDLRs in liver and enhanced LDL clearance from plasma. These data demonstrate that PCSK9 regulates the amount of LDLR protein in liver and suggest that inhibitors of PCSK9 may act synergistically with statins to enhance LDLRs and reduce plasma cholesterol.


Figures

Fig. 1.
Fig. 1.
FPLC profiles and SDS/PAGE of plasma apolipoproteins from WT and Pcsk9–/– mice. (A) Plasma from 16 WT and 16 Pcsk9–/– male mice was pooled (6.5 ml for each genotype) and subjected to ultracentrifugation at d = 1.215 g/ml. The lipoprotein fractions were separated by FPLC gel filtration, and the cholesterol content of each fraction was measured (16). (B) SDS/PAGE of plasma apolipoproteins from WT and Pcsk9–/– mice. Equal aliquots (0.5 ml) from three consecutive FPLC fractions were pooled and delipidated, and apoproteins were precipitated (16). Apoproteins were subjected to 3–15% gradient SDS/PAGE and stained with Coomassie blue. The positions of migration of apoB100, apoB48, apoE, and apoAI are indicated.
Fig. 2.
Fig. 2.
Levels of proteins in livers of WT and Pcsk9–/– mice. Livers from mice described in Table 1 were pooled, and aliquots of membrane protein (40 μg), whole cell lysate (30 μg), or nuclear protein (30 μg) were subjected to SDS/PAGE (7). (A) Immunoblot analyses of PCSK9, ARH (whole cell lysate), LDLR, LRP, and RAP (membrane fraction). P and C for PCSK9 denote the proprotein and cleaved forms of PCSK9, respectively. (B) Immunoblot analysis of SREBP-1, SREBP-2 (membrane and nuclear fractions), and cAMP response element binding protein (CREB) (nuclear fraction). P and N denote the precursor and cleaved nuclear forms of SREBP-1 and SREBP-2. Similar results were obtained in four independent experiments.
Fig. 3.
Fig. 3.
Indirect immunofluorescence in liver using antibodies against LDLR. Frozen sections of liver from Ldlr–/– (A), WT (B), and Pcsk9–/– (C) mice were incubated with a polyclonal antibody against the LDLR. Bound IgG was detected with 20 μg/ml Alexa Fluor 488-labeled goat anti-rabbit IgG (20).
Fig. 4.
Fig. 4.
Plasma clearance of 125I-labeled mouse LDL in WT and Pcsk9–/– mice. (A) Six male mice (10–12 weeks of age) of the indicated genotype were injected i.v. with 125I-labeled LDL (30 μg of protein, 294 cpm/ng apoB protein). Blood was obtained at 30 s (time 0) and at 5, 10, 15, and 30 min for quantification of plasma content of 125I-labeled total apoB (17). (B) Six male mice (10–12 weeks of age) of the indicated genotype were injected i.v. with the same 125I-labeled LDL used in A. Blood was obtained at 30 s (time 0) and at 0.5, 1, 2, and 4 h for quantification of plasma content of 125I-labeled total apoB. Data are plotted as the percentage of zero time value. Each value represents mean ± SEM of six mice.
Fig. 5.
Fig. 5.
Rates of apoB secretion by primary hepatocytes from WT mice and Pcsk9–/– mice. Hepatocytes were prepared from mice of the indicated genotype, and apoB48 and apoB100 were immunoprecipitated and separated by SDS/PAGE gel electrophoresis as described under Materials and Methods. The data are expressed as the apoB content in the medium as a percentage of the 35S-labeled apoB in the cells at zero time. Each value is mean ± SEM of duplicate incubations from eight WT and eight Pcsk9–/– mice. *, Statistical difference of P < 0.05 (Student's t test).
Fig. 6.
Fig. 6.
Levels of proteins in livers of WT and Pcsk9–/– mice fed chow (C) or chow supplemented with 0.2% lovastatin (L). Livers from four male mice in the groups of Table 2 were pooled, and aliquots of membrane protein (40 μg), whole cell lysate (30 μg), or nuclear protein (30 μg) were subjected to SDS/PAGE. (A) Immunoblot analysis of PCSK9, ARH (whole cell lysate), SREBP-2 (membrane and nuclear fractions), cAMP response element binding protein (CREB) (nuclear fraction), LRP, and RAP (membrane fraction). P and C for PCSK9 denote the proprotein and cleaved forms of PCSK9. For SREBP-2, P and N denote the precursor and cleaved nuclear forms. (B) Immunoblot analyses of LDLR and RAP. A 125I-labeled secondary anti-rabbit antibody from donkey was used for the LDLR and RAP to quantify the expression of the LDLR by using a PhosphorImager. The relative expression of the LDLR protein is normalized to the amount of LDLR expressed in livers of WT mice fed chow. (C) Relative amount of hepatic LDLR protein in WT and Pcsk9–/– mice fed 0.2% lovastatin versus chow. Each symbol represents an independent experiment with four mice per group.
Fig. 7.
Fig. 7.
Plasma clearance of 125I-labeled mouse LDL in WT and Pcsk9–/– mice fed chow or lovastatin. Eight male mice (10–12 weeks of age) of the indicated genotype were fed chow or chow supplemented with 0.2% lovastatin for 7 days. Plasma clearance of 125I-labeled total apoB was determined as described in the legend of Fig. 4. *, Statistical difference of P < 0.05 (Student's t test) between Pcsk9–/– mice fed chow or lovastatin.

References

    1. Goldstein, J. L. & Brown, M. S. (1977) Annu. Rev. Biochem. 46, 897–930. - PubMed
    1. Dietschy, J. M., Turley, S. D. & Spady, D. K. (1993) J. Lipid Res. 34, 1637–1659. - PubMed
    1. Horton, J. D., Goldstein, J. L. & Brown, M. S. (2002) J. Clin. Invest. 109, 1125–1131. - PMC - PubMed
    1. Horton, J. D., Shah, N. A., Warrington, J. A., Anderson, N. N., Park, S. W., Brown, M. S. & Goldstein, J. L. (2003) Proc. Natl. Acad. Sci. USA 100, 12027–12032. - PMC - PubMed
    1. Maxwell, K. N. & Breslow, J. L. (2004) Proc. Natl. Acad. Sci. USA 101, 7100–7105. - PMC - PubMed

Publication types

MeSH terms