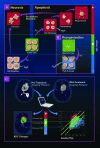
Functional diffusion map: a noninvasive MRI biomarker for early stratification of clinical brain tumor response
- PMID: 15805192
- PMCID: PMC555936
- DOI: 10.1073/pnas.0501532102
Functional diffusion map: a noninvasive MRI biomarker for early stratification of clinical brain tumor response
Abstract
Assessment of radiation and chemotherapy efficacy for brain cancer patients is traditionally accomplished by measuring changes in tumor size several months after therapy has been administered. The ability to use noninvasive imaging during the early stages of fractionated therapy to determine whether a particular treatment will be effective would provide an opportunity to optimize individual patient management and avoid unnecessary systemic toxicity, expense, and treatment delays. We investigated whether changes in the Brownian motion of water within tumor tissue as quantified by using diffusion MRI could be used as a biomarker for early prediction of treatment response in brain cancer patients. Twenty brain tumor patients were examined by standard and diffusion MRI before initiation of treatment. Additional images were acquired 3 weeks after initiation of chemo- and/or radiotherapy. Images were coregistered to pretreatment scans, and changes in tumor water diffusion values were calculated and displayed as a functional diffusion map (fDM) for correlation with clinical response. Of the 20 patients imaged during the course of therapy, 6 were classified as having a partial response, 6 as stable disease, and 8 as progressive disease. The fDMs were found to predict patient response at 3 weeks from the start of treatment, revealing that early changes in tumor diffusion values could be used as a prognostic indicator of subsequent volumetric tumor response. Overall, fDM analysis provided an early biomarker for predicting treatment response in brain tumor patients.
Figures


Similar articles
-
Evaluation of the functional diffusion map as an early biomarker of time-to-progression and overall survival in high-grade glioma.Proc Natl Acad Sci U S A. 2005 Nov 15;102(46):16759-64. doi: 10.1073/pnas.0508347102. Epub 2005 Nov 2. Proc Natl Acad Sci U S A. 2005. PMID: 16267128 Free PMC article.
-
The functional diffusion map: an imaging biomarker for the early prediction of cancer treatment outcome.Neoplasia. 2006 Apr;8(4):259-67. doi: 10.1593/neo.05844. Neoplasia. 2006. PMID: 16756718 Free PMC article.
-
Perfusion magnetic resonance imaging predicts patient outcome as an adjunct to histopathology: a second reference standard in the surgical and nonsurgical treatment of low-grade gliomas.Neurosurgery. 2006 Jun;58(6):1099-107; discussion 1099-107. doi: 10.1227/01.NEU.0000215944.81730.18. Neurosurgery. 2006. PMID: 16723889
-
Diffusion MRI: a new strategy for assessment of cancer therapeutic efficacy.Mol Imaging. 2002 Oct;1(4):336-43. doi: 10.1162/15353500200221482. Mol Imaging. 2002. PMID: 12926229 Review.
-
Anaplastic oligodendroglioma responding favorably to intranasal delivery of perillyl alcohol: a case report and literature review.Surg Neurol. 2006 Dec;66(6):611-5. doi: 10.1016/j.surneu.2006.02.034. Epub 2006 Jul 21. Surg Neurol. 2006. PMID: 17145324 Review.
Cited by
-
An approach to identify, from DCE MRI, significant subvolumes of tumors related to outcomes in advanced head-and-neck cancer.Med Phys. 2012 Aug;39(8):5277-85. doi: 10.1118/1.4737022. Med Phys. 2012. PMID: 22894453 Free PMC article.
-
Diffusion MRI in the early diagnosis of malignant glioma.J Neurooncol. 2007 Apr;82(2):221-5. doi: 10.1007/s11060-006-9273-3. Epub 2006 Oct 7. J Neurooncol. 2007. PMID: 17029014
-
Infiltrative patterns of glioblastoma spread detected via diffusion MRI after treatment with cediranib.Neuro Oncol. 2010 May;12(5):466-72. doi: 10.1093/neuonc/nop051. Epub 2010 Jan 22. Neuro Oncol. 2010. PMID: 20406897 Free PMC article. Clinical Trial.
-
Beyond T2 and 3T: New MRI techniques for clinicians.Clin Transl Radiat Oncol. 2019 Apr 16;18:87-97. doi: 10.1016/j.ctro.2019.04.009. eCollection 2019 Sep. Clin Transl Radiat Oncol. 2019. PMID: 31341982 Free PMC article. Review.
-
Evaluation of the functional diffusion map as an early biomarker of time-to-progression and overall survival in high-grade glioma.Proc Natl Acad Sci U S A. 2005 Nov 15;102(46):16759-64. doi: 10.1073/pnas.0508347102. Epub 2005 Nov 2. Proc Natl Acad Sci U S A. 2005. PMID: 16267128 Free PMC article.
References
-
- Jemal, A., Tiwari, R. C., Murray, T., Ghafoor, A., Samuels, A., Ward, E., Feuer, E. J. & Thun, M. J. (2004) CA Cancer J. Clin. 54, 8–29. - PubMed
-
- Laws, E. R., Parney, I. F., Huang, W., Anderson, F., Morris, A. M., Asher, A., Lillehei, K. O., Bernstein, M., Brem, H., Sloan, A., et al. (2003) J. Neurosurg. 99, 467–473. - PubMed
-
- DeAngelis, L. M. (2001) N. Engl. J. Med. 344, 114–123. - PubMed
-
- Walker, M. D., Alexander, E., Jr., Hunt, W. E., MacCarty, C. S., Mahaley, M. S., Jr., Mealey, J., Jr., Norrell, H. A., Owens, G., Ransohoff, J., Wilson, C. B., et al. (1978) J. Neurosurg. 49, 333–343. - PubMed
-
- Chisholm, R. A., Stenning, S. & Hawkins, T. D. (1989) Clin. Radiol. 40, 17–21. - PubMed
Publication types
MeSH terms
Substances
Grants and funding
LinkOut - more resources
Full Text Sources
Other Literature Sources
Medical

