. 2005 May;17(5):1532-48.
doi: 10.1105/tpc.104.030551. Epub 2005 Apr 1.

Regulation by external K+ in a maize inward shaker channel targets transport activity in the high concentration range

Affiliations

Regulation by external K+ in a maize inward shaker channel targets transport activity in the high concentration range

Yan-Hua Su et al. Plant Cell. 2005 May.

Abstract

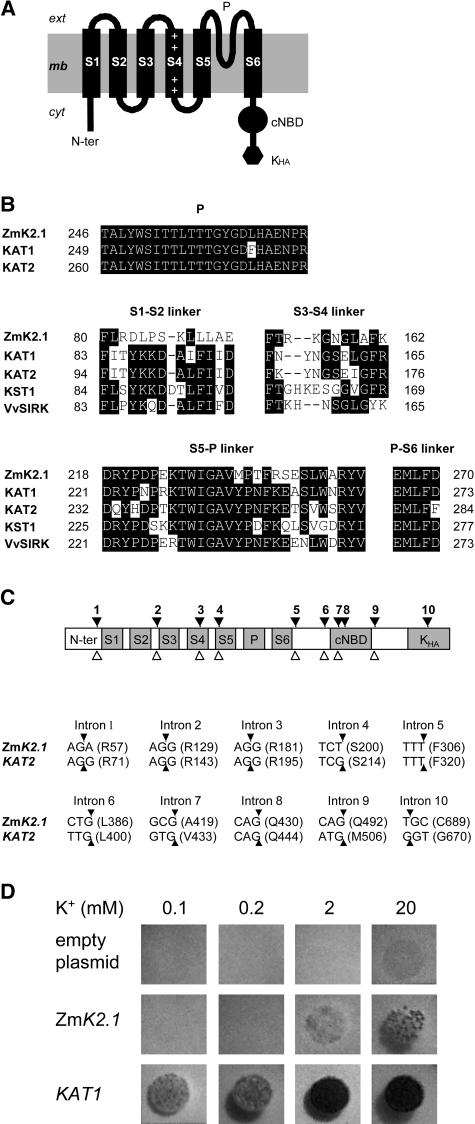
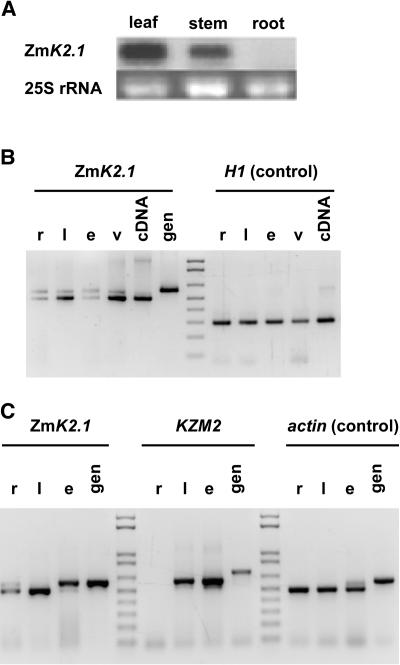
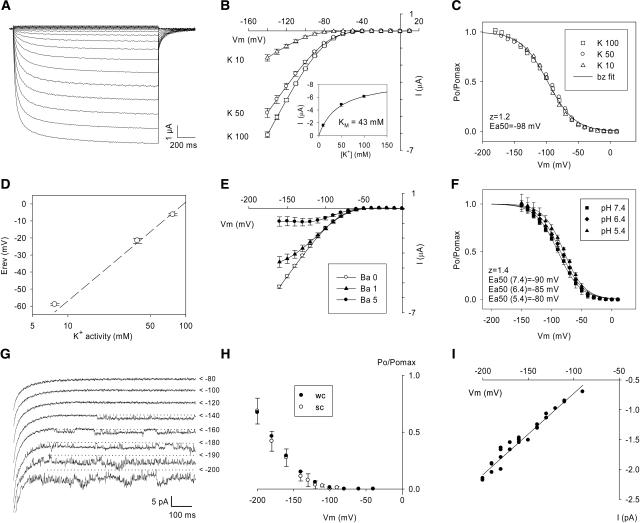
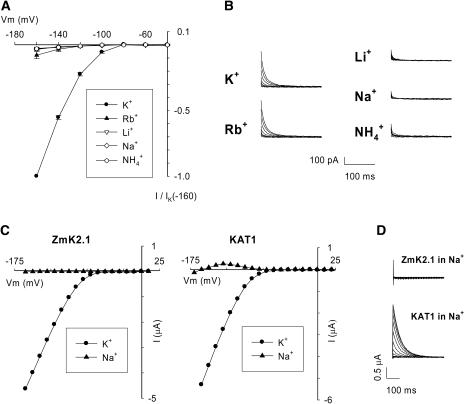
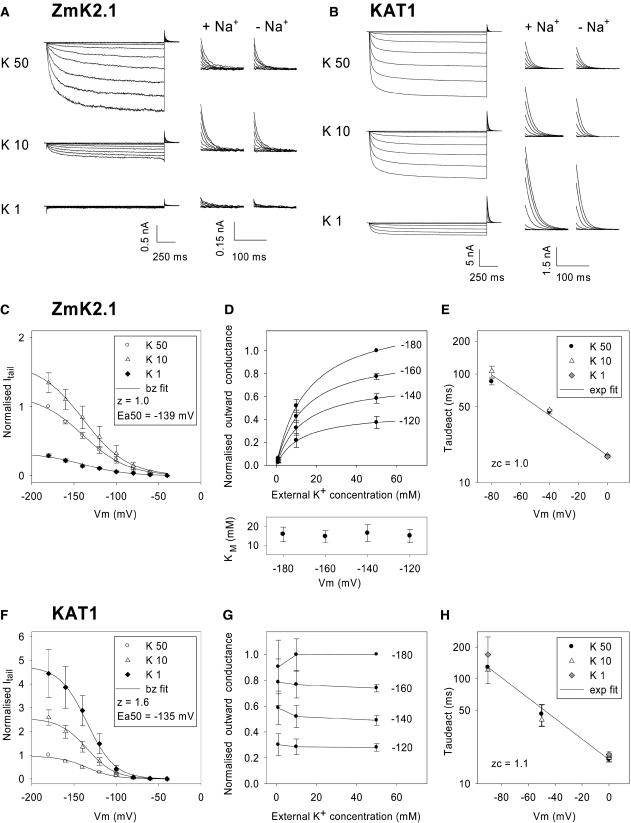
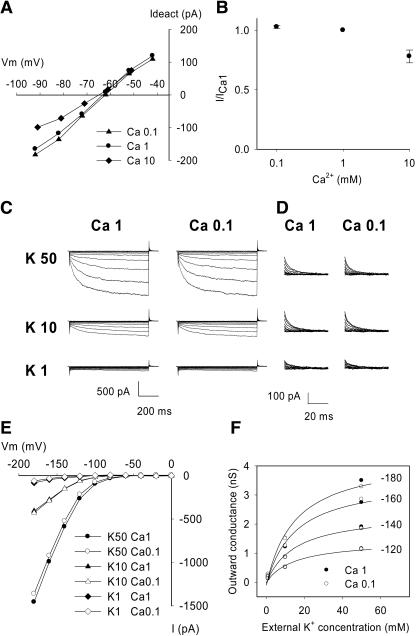
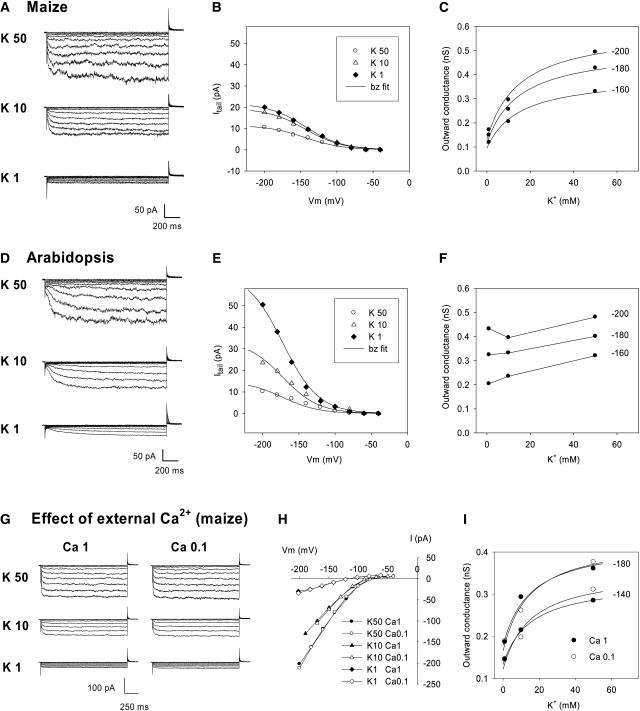
An inward Shaker K(+) channel identified in Zea mays (maize), ZmK2.1, displays strong regulation by external K(+) when expressed in Xenopus laevis (African clawed frog) oocytes or COS cells. ZmK2.1 is specifically activated by K(+) with an apparent K(m) close to 15 mM independent of the membrane hyperpolarization level. In the absence of K(+), ZmK2.1 appears to enter a nonconducting state. Thus, whatever the membrane potential, this maize channel cannot mediate K(+) influx in the submillimolar concentration range, unlike its relatives in Arabidopsis thaliana. Its expression is restricted to the shoots, the strongest signal (RT-PCR) being associated with vascular/bundle sheath strands. Based on sequence and gene structure, the closest relatives of ZmK2.1 in Arabidopsis are K(+) Arabidopsis Transporter 1 (KAT1) (expressed in guard cells) and KAT2 (expressed in guard cells and leaf phloem). Patch-clamp analyses of guard cell protoplasts reveal a higher functional diversity of K(+) channels in maize than in Arabidopsis. Channels endowed with regulation by external K(+) similar to that of ZmK2.1 (channel activity regulated by external K(+) with a K(m) close to 15 mM, regulation independent of external Ca(2+)) constitute a major component of the maize guard cell inward K(+) channel population. The presence of such channels in maize might reflect physiological traits of C4 and/or monocotyledonous plants.


Figures

Figure 1.
Figure 1.
Identification of ZmK2.1, a Maize Inward K+ Channel of the Shaker Family. (A) Topology of the ZmK2.1 polypeptide. The hydrophobic core of Shaker channels typically displays six transmembrane segments, S1 to S6. S4, the channel voltage sensor, carries positively charged residues (+). The pore-forming domain (P) is present between S5 and S6. A putative cyclic nucleotide binding domain (cNBD) and a domain rich in hydrophobic and acidic residues (Kha) are present in the cytoplasmic C-terminal region. (B) Comparison of the ZmK2.1 amino acid sequence with that of group 2 Shakers from other plant species (KAT1 and KAT2 from Arabidopsis, KST1 from potato, and VvSIRK from grapevine). Top, Alignment of the pore domains. Middle and bottom, Alignment of the S1-S2, S3-S4, S5-P, and P-S6 extracellular linkers. (C) Structure of ZmK2.1. Top, The positions of the 10 introns identified in the ZmK2.1 gene, indicated by black arrowheads, strictly correspond to those of the 10 introns identified in the Arabidopsis KAT2 Shaker channel gene. The open arrowheads below indicate the positions of the eight introns in the Arabidopsis KAT1 Shaker gene. Bottom, Conservation of intron positions within the coding sequence between ZmK2.1 and KAT2. For each intron, the interrupted codon, if any (the arrowheads indicate the positions of the interrupting introns), or the codon just upstream of the intron is given. The corresponding amino acid (single-letter code) and the position of this residue in the predicted sequence are indicated in parentheses. (D) Yeast complementation tests. The yeast Wagf2 strain deficient for K+ uptake was transformed with either the empty pFL61 plasmid (control), ZmK2.1 cDNA in pFL61, or the Arabidopsis KAT1 cDNA in pFL61. Drop tests were performed on selective agar media containing 0.1, 0.2, 2, or 20 mM K+ (added as KCl). The plates were photographed after 3 d of incubation at 28°C.
Figure 2.
Figure 2.
Expression of ZmK2.1 in the Plant. (A) RNA gel blot analysis. The blot (10 μg of total RNA per lane) was hybridized with 32P-labeled ZmK2.1 probe. (B) RT-PCR analysis. r, root; l, leaf without central vascular/bundle sheath strand; e, epidermis; v, central vascular/bundle sheath strand; gen, genomic DNA. Histone H1 was used as a control. (C) Comparison of ZmK2.1 and KZM2 expression by RT-PCR analysis. l, leaf; r, e, and gen, same as in (B). Actin was used as a control. The actual amplification of KZM2 (GenBank accession number AJ558238) cDNA was checked by sequencing the PCR products.
Figure 3.
Figure 3.
Conduction and Gating Properties of ZmK2.1 Expressed in Xenopus Oocytes ([A] to [F]) or COS Cells ([G] to [I]). (A) Inwardly rectifying currents recorded in an oocyte expressing ZmK2.1. Voltages applied from a holding potential of −40 mV ranged from −140 to +10 mV with an increment of 10 mV. K+ concentration in the bath was 100 mM (pH 7.4). (B) Current-voltage relationships at steady state in different bath K+ concentrations (10, 50, or 100 mM, pH 7.4). Inset, Mean currents recorded at −140 mV plotted versus the bath K+ concentration were fitted with a Michaelis-Menten equation (solid line), leading to an apparent Km of 43 mM. (C) Analysis of ZmK2.1 activation at different external K+ concentrations (10, 50, or 100 mM [90, 50, and 0 mM NaCl, respectively], pH 7.4). The solid line is a Boltzmann (bz) fit of the relative open probability (Po/Pomax) versus membrane potential (Véry et al., 1995). z and Ea50, equivalent gating charge and half-activation potential, respectively, obtained from the Boltzmann fit. (D) Analysis of ZmK2.1 selectivity. Zero-current potentials (Erev) were determined in bath solutions differing in K+ and Na+ concentrations (10, 50, or 100 mM K+, along with 90, 50, or 0 mM Na+, respectively, pH 7.4). (E) ZmK2.1 blockage by Ba2+ at steady state. BaCl2 was present in the bath at 0, 1, or 5 mM. K+ concentration was 50 mM (pH 7.4). (F) Effect of external pH on ZmK2.1 activation. K+ concentration in the bath was 50 mM. Lines are Boltzmann fits. Data in (B), (D), (E), and (F) are means ± sd (n = 3). (G) Single-channel current traces recorded in COS cells in the outside-out patch-clamp configuration. External and internal K+ concentrations were 50 and 150 mM, respectively. Applied voltages from a holding potential of 0 mV are indicated at right of the traces. Carets mark the current levels corresponding to closed ZmK2.1 channels. (H) Comparison of ZmK2.1 voltage dependence determined either at the single-channel (sc) or whole cell (wc) level in COS cells. Analyzed single-channel (outside-out patch configuration) and whole cell data were from the same cell. Ionic conditions were as described for (G). The relative open probability data at the single-channel level are means from six successive recordings ± se. (I) Single-channel conductance (recording conditions as described for [G]).
Figure 4.
Figure 4.
Effect of the Nature of the External Monovalent Cation on ZmK2.1 Conductance and Activity. (A) and (B) Currents mediated by ZmK2.1 in COS cells were recorded in bath solutions successively containing KCl, RbCl, LiCl, NaCl, and NH4Cl at a concentration of 50 mM. (A) Current-voltage relationships at steady state. Currents were normalized for each cell by current level in the presence of K+ at −160 mV. Values shown are means ± se (n = 5). (B) Examples of deactivation currents recorded at 0 mV after activation steps at voltages ranging from −40 to −160 mV. The recordings shown were obtained from the same cell. (C) and (D) Comparison of currents in oocytes expressing either ZmK2.1 or KAT1 in bath solutions containing 100 mM KCl or 100 mM NaCl. (C) Current-voltage relationships at steady state. (D) Deactivation currents recorded at −40 mV after activation steps at voltages ranging from +10 to −160 mV in a bath containing NaCl. The steady state and deactivation currents shown for each channel are from the same oocyte.
Figure 5.
Figure 5.
Effect of External K+ Concentration on ZmK2.1 and KAT1 Activity. (A) and (B) Current traces recorded in COS cells expressing either ZmK2.1 (A) or KAT1 (B) in the presence of different external K+ concentrations: 50, 10, or 1 mM. The internal K+ concentration was 150 mM. The voltage-clamp protocol consisted of a channel activation step, with applied voltages ranging from −40 to −200 mV, followed by a deactivation step at 0 mV. At left, full traces are shown. The solutions containing 10 or 1 mM K+ were supplemented with 40 or 49 mM NaCl, respectively, for ionic and osmotic strength adjustment. Middle and right, Zoom on deactivation currents recorded at 0 mV after the activation step. In the middle panels (+ Na+), the ionic strength of the bath solutions containing 10 or 1 mM K+ was adjusted with NaCl (as at left). In the right panels (− Na+), no NaCl was added to the bath solutions, the decrease in KCl concentration being compensated for at the osmotic level with mannitol. (C) to (H) Analysis of ZmK2.1 ([C] to [E]) and KAT1 ([F] to [H]) deactivation currents in the presence of 50, 10, or 1 mM external K+. Na+, N-methyl-d-glucamine, or mannitol was added to compensate for the changes in external K+ concentrations. No difference being observed between the three conditions, the data were pooled. Values shown are means ± se, with n = 6 in (C) to (E) and n = 5 in (F) to (H). (C) and (F) Deactivation (tail) currents, recorded at 0 mV at 6 ms after the start of the step, plotted against the activation voltage. Deactivation currents were normalized for each cell by the current recorded in 50 mM K+ at −180 mV to suppress current variability caused by differences in cell size and level of expression. Solid lines are Boltzmann (bz) fits. (D) and (G) Effect of external K+ on the GKout in ZmK2.1 (D) or KAT1 (G). Initial (outward) deactivation currents were assumed to follow the modified Ohm's law (Blatt, 1992; Hille, 1992): I = GK (E – EK), where GK is the macroscopic K+ conductance, E is the membrane potential (here 0 mV), and EK is the K+ equilibrium potential. The GK values were calculated from deactivation currents recorded after activation at −120, −140, −160, or −180 mV. For each cell, the resulting GK values were normalized by the value determined in 50 mM external K+ at −180 mV to suppress variability attributable to differences in cell size and level of expression. For ZmK2.1, normalized GK values plotted versus the external K+ concentration were fitted with a Michaelis-Menten equation for each of the four activation potentials. Resulting apparent Km values are shown at the bottom of (D) (means ± se, n = 5). Solid lines at the top of (D) are mean Michaelis-Menten adjustments (using the mean Km values indicated at bottom). (E) and (H) Effect of external K+ on the kinetics of current deactivation in ZmK2.1 (E) and KAT1 (H). Deactivation time constants (“Taudeact”; means ± se, n = 6) were obtained from monoexponential fits of deactivation currents recorded at membrane potentials ranging from −90 to 0 mV. Fits of the voltage dependence of deactivation time constants with a monoexponential function (exp fit; solid lines) were used to determine zc, the equivalent charge involved in channel-closing transitions near the open state (Liman et al., 1991).
Figure 6.
Figure 6.
Effect of External Ca2+ on ZmK2.1 Currents in COS Cells. (A) ZmK2.1 permeability to Ca2+. Example of deactivation currents recorded, after an activation step at −140 mV, at membrane potentials ranging from −92 to −42 mV in bath solutions containing 10 mM K+ and successively 0.1, 1, and 10 mM Ca2+ [Ca2+ added as Ca(OH)2/Mes, pH 6.0]. EK was −64 mV when the cell was bathed with the solution containing 0.1 or 1 mM Ca2+ and was −65.5 mV in the solution containing 10 mM Ca2+. Mean zero-current potentials (±se, n = 4) recorded in the latter solutions were −63 ± 0.5 mV, −63 ± 1 mV, and −65 ± 1 mV, respectively. (B) Sensitivity of ZmK2.1 steady state inward current to external Ca2+. ZmK2.1 whole cell currents were recorded in bath solutions containing 10 mM KCl and successively 0.1, 1, and 10 mM Ca2+ (same solutions as in [A]). I/ICa1, magnitude of the steady state currents recorded at −140 mV in 0.1, 1, and 10 mM Ca2+ standardized by the magnitude of the corresponding current in 1 mM Ca2+ (means ± se; n = 5). (C) to (F) Effects of external Ca2+ on ZmK2.1 sensitivity to external K+. Typical examples from four experiments are shown. (C) Example of whole cell currents recorded successively in different external K+ concentrations (50, 10, and 1 mM) in the presence of either 1 or 0.1 mM external Ca2+ (Ca 1 and Ca 0.1, respectively). In solutions in which K+ concentration was 10 or 1 mM or Ca2+ was 0.1 mM, NaCl was added for ionic and osmotic strength adjustment. The voltage-clamp protocol was the same as described for Figure 5A. (D) Magnification of deactivation currents recorded at 0 mV. (E) Effect of external Ca2+ on ZmK2.1 I/V relationships at steady state. The bath solution contained 50, 10, or 1 mM K+ and either 1 or 0.1 mM Ca2+. (F) Effect of external Ca2+ on the outward macroscopic conductance at 0 mV (see legend to Figure 5). Solid lines indicate Michaelis-Menten adjustments using the mean Km value (15 mM) determined for ZmK2.1 in COS cells (see Figure 5D).
Figure 7.
Figure 7.
Effect of External K+ Concentration on Maize and Arabidopsis Guard Cell Inwardly Rectifying Channel Activity. (A) and (D) Typical current traces recorded in maize (A) and Arabidopsis (D) guard cell protoplasts in bath solutions successively containing 50, 10, and 1 mM K+ (decrease in K+ concentration adjusted at the osmotic level with mannitol). The internal K+ concentration was 125 mM. The voltage-clamp protocol was identical to that described for Figure 5. (B), (C), (E), and (F) Analysis of deactivation currents in maize ([B] and [C]) and Arabidopsis ([E] and [F]). Data presented in (B) and (C) (and [E] and [F], respectively) were obtained from the recordings shown in (A) (and [D], respectively). (B) and (E) Deactivation (tail) currents measured 10 ms after the start of the deactivation pulse, plotted versus the activation potential. Solid lines are Boltzmann (bz) fits. (C) and (F) Outward macroscopic conductance (GKout = Itail/(E – EK)) at 0 mV plotted versus external K+ concentration (see legend to Figure 5). Conductance values were calculated for the three activation potentials −200, −180, and −160 mV. In (C), the data were fitted (solid lines) based on the assumption that the conductance results from the activity of two kinds of voltage-gated channels: ZmK2.1-like channels displaying regulation by external K+ with the same Km as that determined for ZmK2.1 in COS cells (15 mM; see Figure 5D and text), and channels not regulated by external K+, providing a constant contribution to the conductance over the entire K+ concentration range. (G) to (I) Effect of external Ca2+ on inwardly rectifying channel activity in maize guard cells. (G) Comparison of protoplast inward current in bath solutions containing either 1 or 0.1 mM Ca2+. The bath K+ concentration was successively 50, 10, and 1 mM. The voltage-clamp protocol was as described for (A). (H) Effect of external Ca2+ on I/V relationships at steady state. (I) Effect of external Ca2+ on the outward macroscopic conductance at 0 mV (same analysis as described for [C]).

Similar articles

Cited by

References

    1. Aiyar, J., Nguyen, A.N., Chandy, K.G., and Grissmer, S. (1994). The P-region and S6 of Kv3.1 contribute to the formation of the ion conduction pathway. Biophys. J. 67, 2261–2264. - PMC - PubMed
    1. Anderson, J.A., Huprikar, S.S., Kochian, L.V., Lucas, W.J., and Gaber, R.F. (1992). Functional expression of a probable Arabidopsis thaliana potassium channel in Saccharomyces cerevisiae. Proc. Natl. Acad. Sci. USA 89, 3736–3740. - PMC - PubMed
    1. Assmann, S.M., and Wang, X.Q. (2001). From milliseconds to millions of years: Guard cells and environmental responses. Curr. Opin. Plant Biol. 4, 421–428. - PubMed
    1. Blatt, M.R. (1985). Extracellular potassium activity in attached leaves and its relation to stomatal function. J. Exp. Bot. 36, 240–251.
    1. Blatt, M.R. (1990). Potassium channel currents in intact stomatal guard cells: Rapid enhancement by abscisic acid. Planta 180, 445–455. - PubMed

Publication types

MeSH terms

Associated data