Comparative Study
. 2005 Apr;15(4):505-15.
doi: 10.1101/gr.3436305.

Comparative genome analyses of Arabidopsis spp.: inferring chromosomal rearrangement events in the evolutionary history of A. thaliana

Affiliations
Comparative Study

Comparative genome analyses of Arabidopsis spp.: inferring chromosomal rearrangement events in the evolutionary history of A. thaliana

Krithika Yogeeswaran et al. Genome Res. 2005 Apr.

Abstract

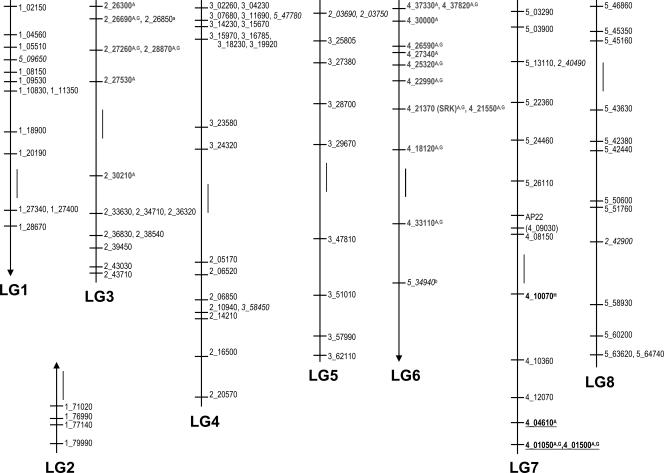
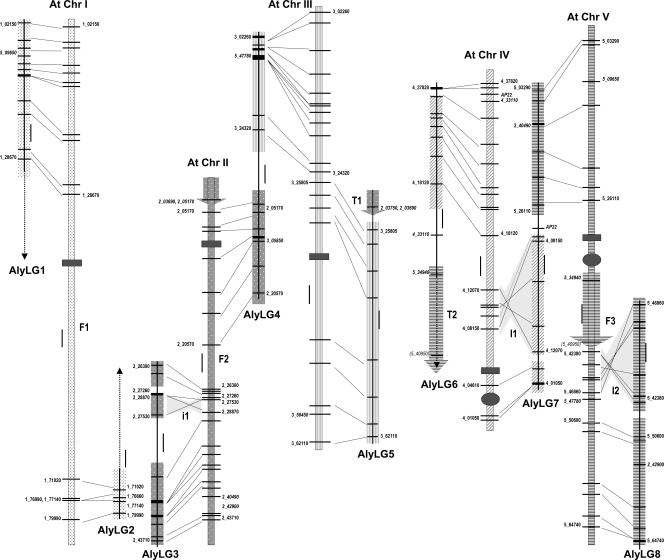
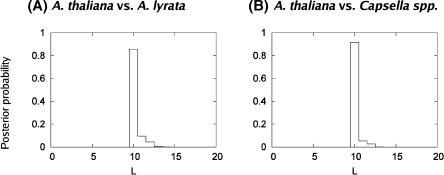
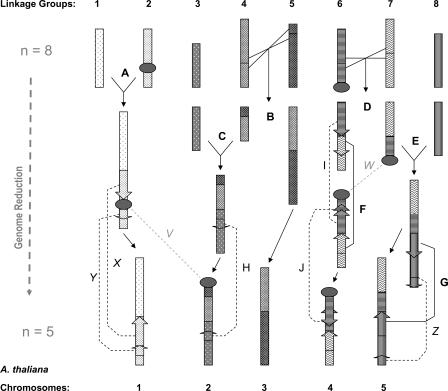
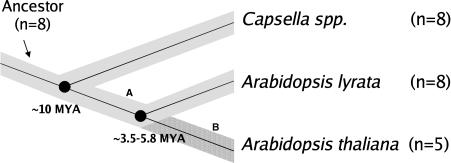
Comparative genome analysis is a powerful tool that can facilitate the reconstruction of the evolutionary history of the genomes of modern-day species. The model plant Arabidopsis thaliana with its n = 5 genome is thought to be derived from an ancestral n = 8 genome. Pairwise comparative genome analyses of A. thaliana with polyploid and diploid Brassicaceae species have suggested that rapid genome evolution, manifested by chromosomal rearrangements and duplications, characterizes the polyploid, but not the diploid, lineages of this family. In this study, we constructed a low-density genetic linkage map of Arabidopsis lyrata ssp. lyrata (A. l. lyrata; n = 8, diploid), the closest known relative of A. thaliana (MRCA approximately 5 Mya), using A. thaliana-specific markers that resolve into the expected eight linkage groups. We then performed comparative Bayesian analyses using raw mapping data from this study and from a Capsella study to infer the number and nature of rearrangements that distinguish the n = 8 genomes of A. l. lyrata and Capsella from the n = 5 genome of A. thaliana. We conclude that there is strong statistical support in favor of the parsimony scenarios of 10 major chromosomal rearrangements separating these n = 8 genomes from A. thaliana. These chromosomal rearrangement events contribute to a rate of chromosomal evolution higher than previously reported in this lineage. We infer that at least seven of these events, common to both sets of data, are responsible for the change in karyotype and underlie genome reduction in A. thaliana.


Figures

Figure 1.
Figure 1.
A. l. lyrata linkage map and segregation ratio distortion. The eight linkage groups of A. l. lyrata as resolved by the mapping of 104 markers are numbered LG1–8 at LOD 3 (markers in parentheses have LOD scores just below 3.0). Figure drawn to scale with vertical bars representing 5-cM mapping distance. Marker names signify the gene locus they represent (1_02150 = At1g02150). Italicized markers demonstrate disruption in synteny due to translocation or duplication followed by deletion. Markers in bold demonstrate transmission ratio distortion. Markers in gray show skewed segregation in favor of P1 alleles, and those that are underlined in favor of P2 alleles. A, distortion of allelic ratios; G, distortion of genic ratios; H, distortion ratio overrepresenting heterozygotes and underrepresenting P2 alleles. a, scoring data does not allow clear assessment of segregation ratios; b, allelic ratio nearly significantly skewed in favor of P1 alleles (0.052).
Figure 2.
Figure 2.
Colinearity of A. l. lyrata linkage map with the A. thaliana genome. A. thaliana chromosomes (At Chr I–V) are represented as patterned bars (drawn to scale, 1 unit = 1 Mbp; gray rectangles, centromeres; gray circles, heterochromatic knobs). A. l. lyrata linkage groups (Aly LG 1–8) are shown in black (drawn to scale, 1 unit = 5cM). Sixteen colinear blocks are highlighted with the same pattern as the At chromosome to which they correspond. Markers defining the ends of each colinear block are shown on the map in black lettering. Markers mapping with LOD score less than 3.0 are featured in parentheses. Italicized markers map to translocated or nonsyntenic regions in A. l. lyrata. Translocations T1 and T2 are highlighted by arrows whose patterns correspond to the At chromosome where their colinear region lies. Major inversions I1 and I2 and minor inversion i1 are highlighted in light gray. Three chromosomal fusions are denoted as F1-F3.
Figure 3.
Figure 3.
Posterior probability plots of A. thalianaA. l. lyrata and A. thalianaCapsella mapping data considering marker order only. Posterior probability plots generated from Bayesian analyses of mapping data accounting for marker orders without distances. (A) A. thalianaA. l. lyrata comparison. (B) A. thalianaCapsella comparison. x-axis: L = estimate of the total number of observable rearrangements; y-axis: Posterior probability estimate for the number of observable rearrangements.
Figure 4.
Figure 4.
Genome reduction in A. thaliana: Parsimony solution of observable chromosomal rearrangement steps. Linkage groups 1–8 of A. l. lyrata, represented as patterned blocks, are shown across the top of the figure; A. thaliana chromosomes I–V at the bottom. A–G: Seven steps that are found to be in common between A. thalianaA. l. lyrata and A. thalianaCapsella spp. genome data; namely B and D, reciprocal translocations; A,C,E, fusion events; F and G, inversions. These seven steps could have occurred in any sequence during genome reduction in A. thaliana's evolutionary history. (H–J) Inversions seen only in the A. thalianaA. l. lyrata comparative map. (V–Z) Rearrangements seen only in the A. thalianaCapsella spp. comparative map, namely X,Y, Z, inversions and V and W, translocations of NORs (V and W not included in statistical analysis).
Figure 5.
Figure 5.
Phylogenetic relationship between Arabidopsis spp. and Capsella spp. The phylogenetic relationship between A. thaliana, A. lyrata, and Capsella spp. is illustrated in this simple cartoon (modified from Koch et al. 1999). Extensive colinearity of mapping data suggests (A) conservation of genome arrangement since the ancestor of the tribe Sisymbrieae (n = 8) until these modern-day taxa with haploid complement of n = 8, and (B) the occurrence of most major genome rearrangement events in the last 5 Myr of A. thaliana's evolutionary history.

Similar articles

Cited by

References

    1. Acarkan, A., Rossberg, M., Koch, M., and Schmidt, R. 2000. Comparative genome analysis reveals extensive conservation for Arabidopsis thaliana and Capsella rubella. Plant J. 23: 55-62. - PubMed
    1. Ahn, S. and Tanksley, S.D. 1993. Comparative linkage maps of rice and maize genomes. Proc. Natl. Acad. Sci. 90: 7980-7984. - PMC - PubMed
    1. Al-Shehbaz, I.A. 1973. The biosystematics of the genus Thelypodium (Cruciferae). Contributions to the Gray Herbarium, Harvard University 204: 3-148.
    1. Altschul, S.F., Gish, W., Miller, W., Myers, E.W., and D. Lipman. 1990. Basic local alignment search tool. J. Mol. Biol. 215: 403-410. - PubMed
    1. The Arabidopsis Genome Initiative. 2000. Analysis of the genome sequence of the flowering plant Arabidopsis thaliana. Nature 408: 796-815. - PubMed

Publication types

Substances

LinkOut - more resources