. 2005 Apr 11;169(1):151-65.
doi: 10.1083/jcb.200407058. Epub 2005 Apr 4.

PI(4,5)P2-dependent microdomain assemblies capture microtubules to promote and control leading edge motility

Affiliations

PI(4,5)P2-dependent microdomain assemblies capture microtubules to promote and control leading edge motility

Tamara Golub et al. J Cell Biol. .

Abstract

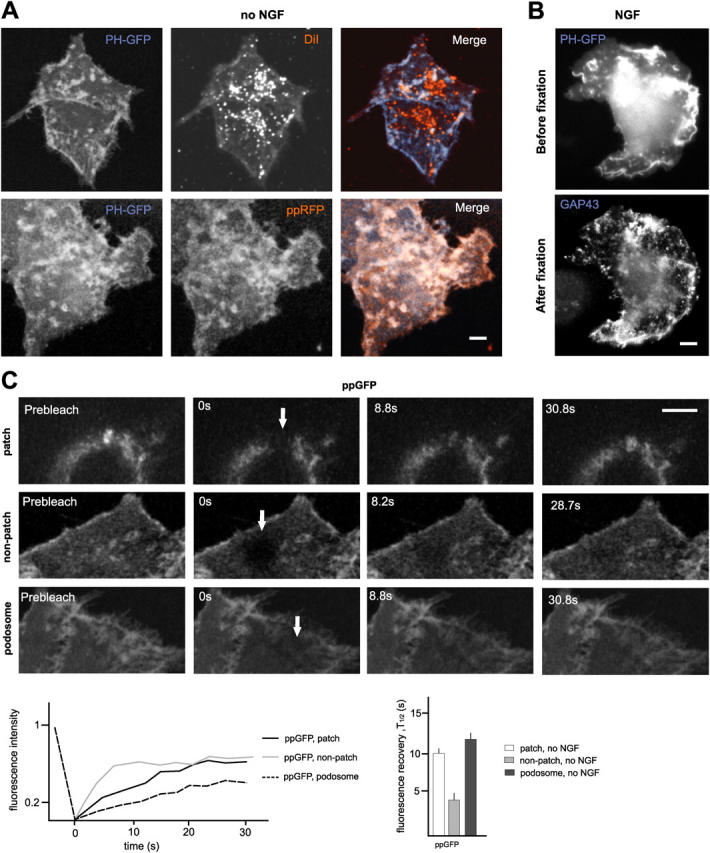
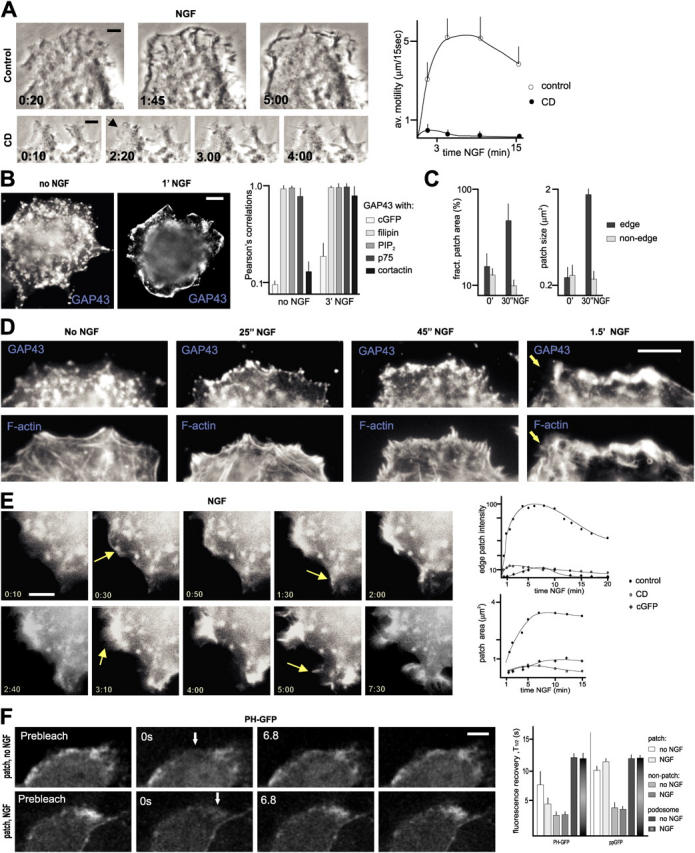
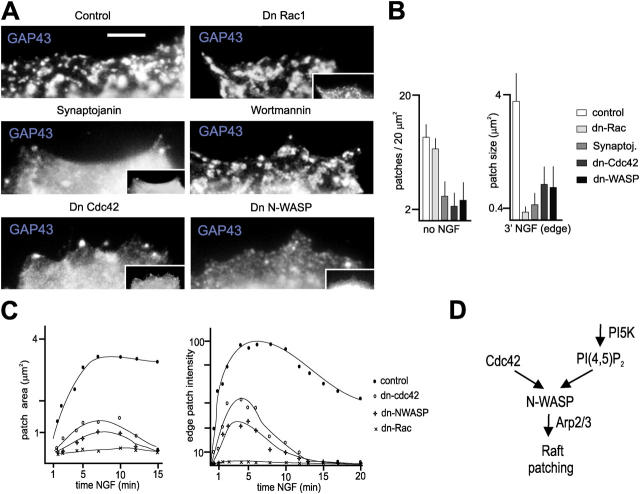
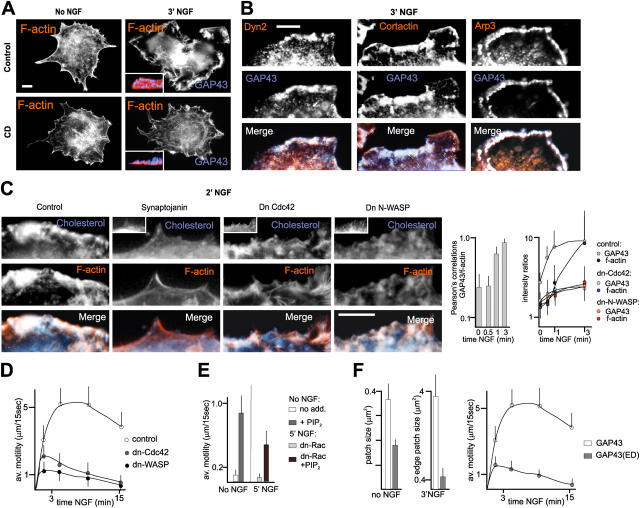
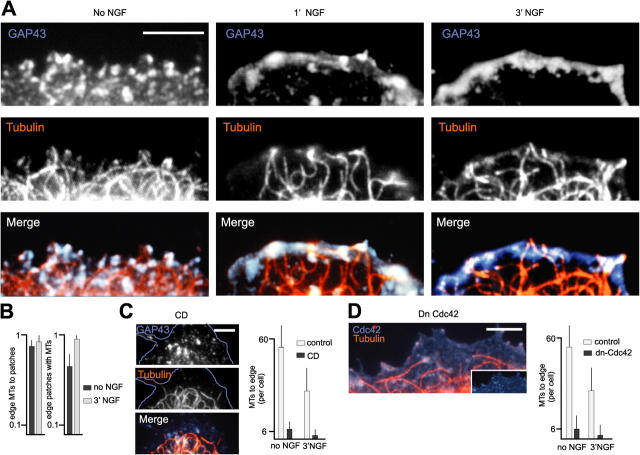
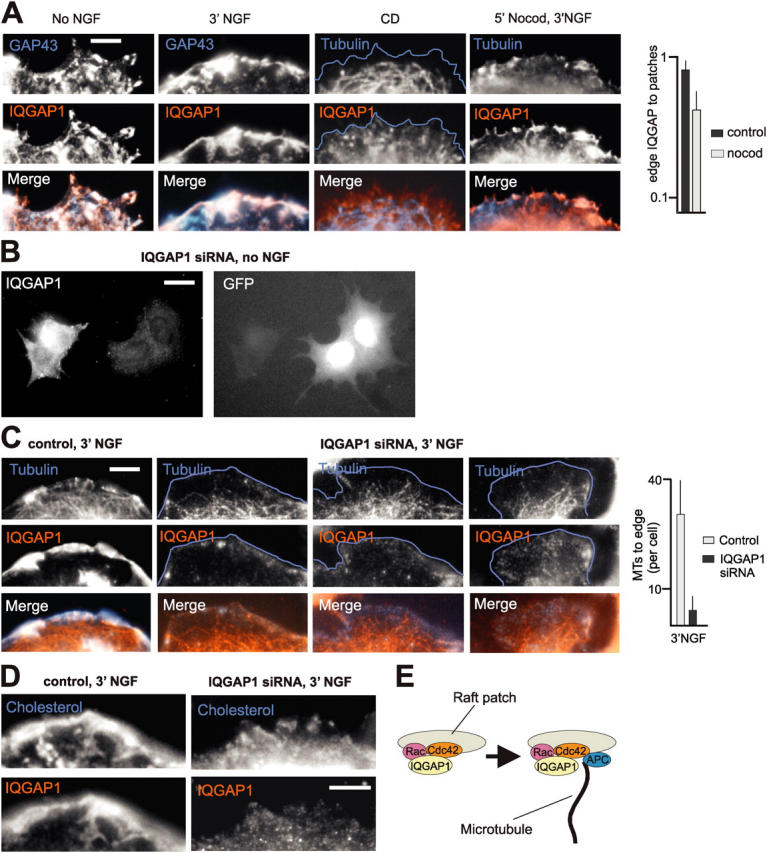
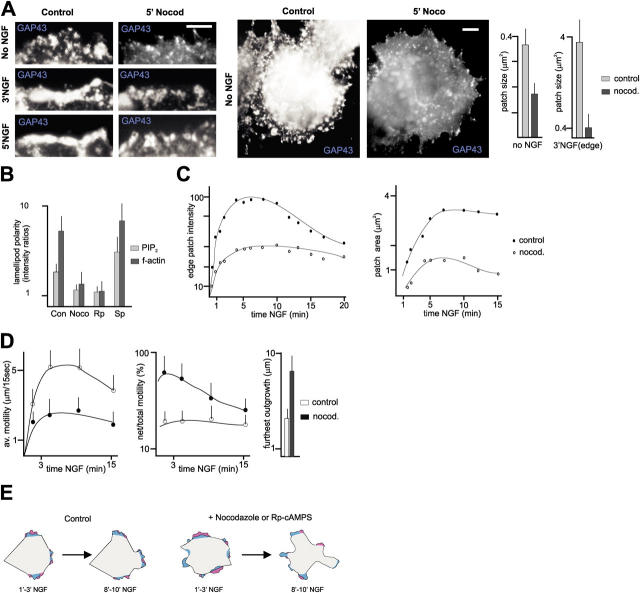
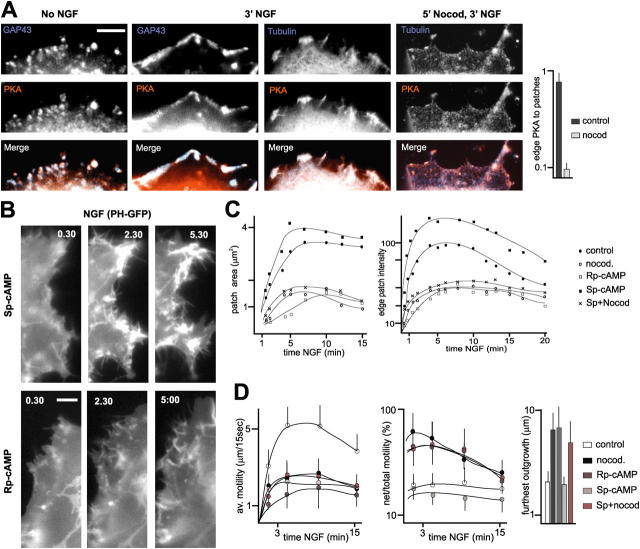
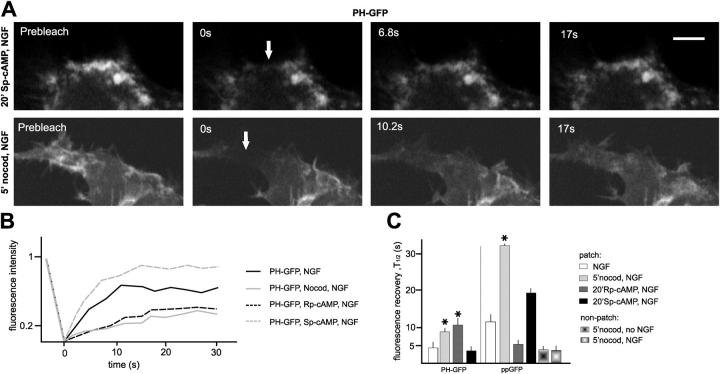
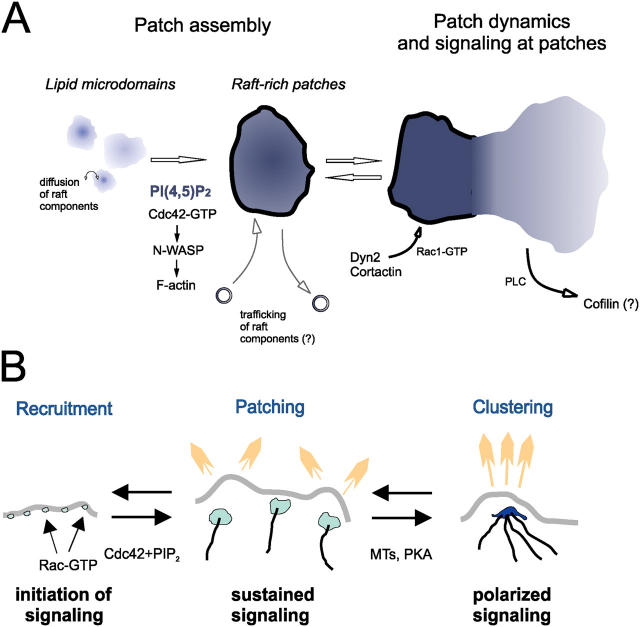
The lipid second messenger PI(4,5)P(2) modulates actin dynamics, and its local accumulation at plasmalemmal microdomains (rafts) might mediate regulation of protrusive motility. However, how PI(4,5)P(2)-rich rafts regulate surface motility is not well understood. Here, we show that upon signals promoting cell surface motility, PI(4,5)P(2) directs the assembly of dynamic raft-rich plasmalemmal patches, which promote and sustain protrusive motility. The accumulation of PI(4,5)P(2) at rafts, together with Cdc42, promotes patch assembly through N-WASP. The patches exhibit locally regulated PI(4,5)P(2) turnover and reduced diffusion-mediated exchange with their environment. Patches capture microtubules (MTs) through patch IQGAP1, to stabilize MTs at the leading edge. Captured MTs in turn deliver PKA to patches to promote patch clustering through further PI(4,5)P(2) accumulation in response to cAMP. Patch clustering restricts, spatially confines, and polarizes protrusive motility. Thus, PI(4,5)P(2)-dependent raft-rich patches enhance local signaling for motility, and their assembly into clusters is regulated through captured MTs and PKA, coupling local regulation of motility to cell polarity, and organization.


Figures

Figure 1.
Figure 1.
Visualization and FRAP-based validation of PI(4,5)P2-rich raft assemblies in living PC12 cells. (A) Visualization of PI(4,5)P2-rich raft assemblies in living cells. (Top) PHδ1-GFP highlights PI(4,5)P2-rich patches that are not emphasized by the lipophilic dye DiD. (Bottom) Co-distribution of PI(4,5)P2-rich raft patches visualized with PHδ1-GFP and ppRFP. The images are z-stacks including all planes of these double-labeled living cells. (B) Comparable labeling patterns for PI(4,5)P2-rich raft complexes in living and fixed PC12 cells. The live-cell image (PH-GFP) was acquired 5′ after the addition of NGF. Fixative was added within 15–20 s after image acquisition, fixed cells were labeled for GAP43, and the PH-GFP-positive cell was retraced. (C) FRAP for ppGFP reveals specific immobilization of raft markers at PI(4,5)P2-rich raft patches. PC12 cells in the absence of NGF. Images are single confocal sections (patch, confocal plane slightly above substrate; nonpatch and podosome, bottom plane of cells). Arrows indicate bleached area at end of photobleaching time. Representative FRAP curves (individual experiments) and average FRAP half-lives (n = 15) are also shown in the figure. Bars, 3 μm.
Figure 2.
Figure 2.
Rapid redistribution and accumulation of PI(4,5)P2-rich raft patches at the cell edge upon induction of protrusive motility. (A) NGF-induced protrusive motility at the cell edge depends on raft integrity. (Left) Phase-contrast time-lapse recordings of PC12 cells treated with NGF in the absence or presence of (CD). Arrow indicates growth of a thin lamellipod in the presence of cyclodextrin (CD). (Right) Quantitative analysis of NGF-induced protrusive motility (forward and backward displacements of cell edge per unit time), without (control) and with cyclodextrin. n = 15 cells. (B) NGF induces a rapid redistribution of cell surface raft patches. (Left) redistribution of raft patches (GAP43) from the dorsal surface (no NGF) to the edge (1 min NGF) of NGF-treated cells. (Right) Co-distribution of raft-associated components at cell surface patches in PC12 cells in the absence and presence of NGF. Pearson's values of 1.0 reflect a complete overlap of compared signals. (C) Rapid redistribution of raft patches in NGF-treated cells. Fractional patch area: fraction of surface area labeled with raft marker (GAP43). Times: no NGF, 30'' NGF. n = 15. (D) Redistribution and accumulation of raft patches at the cell edge in response to NGF precedes actin rearrangements associated with lamellar and lamellipod motility. (E) Dynamics of NGF-induced cell surface PI(4,5)P2 patches visualized with PHδ1-GFP. (Left) Live imaging of PH-GFP. Arrows at 0:30 and 1:30 indicate new cell edge PI(4,5)P2-rich patches predicting lamellipodial motility; at 3:10, PI(4,5)P2-rich domain extending with a lamellipod; at 5:00, appearance of a new distal domain. (Right) Quantitative analysis of cell edge PH-GFP patches in NGF-treated PC12 cells. Average values; control: n = 15; cyclodextrin and cGFP: n = 4. (F) Rapid, NGF-stimulated turnover of PI(4,5)P2 at raft patches. Representative examples (left, panels on the right: 17.0 s) and quantitative analysis of FRAP half-lives (right) for PHδ1-GFP and ppGFP at and outside PI(4,5)P2-rich raft patches. Images are single confocal sections. n = 15. Bars: (A–E) 3 μm; (F) 2 μm.
Figure 3.
Figure 3.
Raft patch accumulation at the cell surface depends on PI(4,5)P2, Cdc42, and N-WASP. (A) Requirement for PI(4,5)P2, Cdc42, and N-WASP to accumulate raft patches at the surface of naive PC12 cells (no NGF). (B) Quantitative analysis of experiments as shown in panel a. Raft marker: GAP43. n = 30 cells. (C) Impaired assembly and persistence of NGF-induced cell surface PI(4,5)P2-rich patches in the presence of dn-Cdc42 or dn-N-WASP. Analysis of PH-GFP lives imaging recordings. Dn-Cdc42, dn-N-WASP: n = 10; dn-Rac: n = 4. (D) Proposed mechanism to induce cell surface raft patching. PI5K: PI-5-kinase. Bar, 2 μm.
Figure 4.
Figure 4.
Requirement for PI(4,5)P2-rich raft patches to promote actin cytoskeleton accumulation and sustained protrusive motility at the leading edge. (A) NGF-induced assembly of f-actin–rich lamellipods depends on raft integrity. The insets show representative x-z profiles of leading edges double labeled for GAP43 (blue, cell surface) and f-actin (orange). (B) Accumulation of proteins involved in actin-based membrane motility (Dynamin2, cortactin, and Arp3) at raft patches in NGF-treated PC12 cells. (C) Actin cytoskeleton accumulation at raft patches in NGF-treated cells. (Left) Prominent accumulation of f-actin at cell edge raft patches 2 min after the addition of NGF. (Right) Co-distribution of raft marker and f-actin signal, and relative raft and f-actin labeling intensities at cell edge patches. n = 10 cells. (D) Reduction in the extent and persistence of NGF-induced protrusive motility in cells expressing dn-Cdc42 or dn-N-WASP. Analysis of phase-contrast time-lapse recordings. Average values; n = 10 cells. (E) Exogenously added PI(4,5)P2 promotes lamellipod motility in the absence of NGF, and some NGF-induced motility in the presence of dn-Rac. n = 8 cells. (F) PC12 cells stably expressing a GAP43(ΔED) construct interfering with the accumulation of raft patches at the cell surface exhibit reduced NGF-induced lamellipodial motility. Raft patches: n = 30 cells; motility: n = 10 cells. Bars, 3 μm.
Figure 5.
Figure 5.
Capture of MTs at cell edge raft patches. (A) MT ends associate with cell edge raft patches in naive and NGF-treated PC12 cells. (B) Quantitative analysis of data as shown in A. The extents to which MTs specifically associate with raft patches at the cell edge are given in fractional values (value of 1 = 100%). n = 30 cells. (C) MT capture at the cell edge depends on raft integrity. Raft disruption (CD, 10') leads to loss of MTs associated with the cell edge. (D) MT capture at the cell edge depends on raft patching. n = 30 cells. Bars, 2 μm.
Figure 6.
Figure 6.
Raft patches capture MTs through IQGAP1. (A) Association of IQGAP1 with cell edge raft patches. The accumulation of IQGAP1 at the cell edge depended on raft integrity, but not on MT integrity. Blue outline (CD), cell edge. Quantitative analysis (fractional values): no NGF, n = 30 cells. (B) Knockdown of IQGAP1 in PC12 cells. Transfected cells coexpressed GFP. (C) Capture of MTs at raft patches depends on IQGAP1. Quantitative analysis of MTs to edge: n = 30 cells. (D) Fragmentation of raft patches (cholesterol) in the absence of IQGAP1. (E) Model of how IQGAP1 may provide a physical link, from cell edge raft patches (Rac-GTP and Cdc42-GTP) to MT plus-ends. Bars: (A, C, and D) 2 μm; (B) 5 μm.
Figure 7.
Figure 7.
Raft patch clustering and organized protrusive motility at the leading edge depend on intact MTs. (A) Fragmentation of cell surface raft patch assemblies in the absence of intact MTs. Quantitative analysis: influence of MT integrity on raft complex size; n = 30 cells. Bars, 2 μm. (B) Influence of MT integrity on the polarization of lamellipodial PI(4,5)P2 and f-actin accumulation in NGF-treated cells (5′ NGF; n = 30 cells). The intensity ratios are a measure for the extent to which lamellipodia with the highest labeling values differ from average lamellipodial labeling values for any given cell. Rp, Rp-cAMPS; Sp, Sp-cAMPS. (C) Influence of MT integrity on the dynamics of PI(4,5)P2 patches. Live imaging of PH-GFP expressing cells; average values, n = 10 cells. (D) Influence of MT integrity on the patterns of NGF-induced motility in PC12 cells. Net/total motility is a measure for locally organized motility (see Materials and methods). n = 10 cells. (E) Schematic of NGF-induced motility with and without intact MTs. Colors indicate areas exhibiting motility during the time intervals indicated at the bottom; the two colors represent lamellipodial configurations at two consecutive time points (violet before blue).
Figure 8.
Figure 8.
MTs target PKA to cell edge raft patches, to promote patch clustering and spatially constrain protrusive motility. (A) Targeting of PKA to cell edge raft patches through MTs. Quantitative analysis: no NGF, n = 30 cells. (B) The activity of PKA promotes PI(4,5)P2 signal (PHδ1-GFP) accumulation and patch compaction at the cell edge. Bars, 2 μm. (C) Rp-cAMPS mimics the effects of nocodazole on PH-GFP patch dynamics, whereas Sp-cAMPS enhances patch clustering in a MT-dependent manner. Average values; n = 10 cells. (D) Rp-cAMPS mimics the effects of nocodazole on NGF-induced motility, and MT disruption suppresses any effect of Sp-cAMPS on leading edge motility. n = 10 cells.
Figure 9.
Figure 9.
MTs and cAMP augment FRAP rates for PI(4,5)P2 at raft patches. All experiments: PC12 cells treated with NGF. (A) Representative examples of PHδ1-GFP FRAP at patches in the presence of the cAMP analogue Sp-cAMPS or nocodazole. Single confocal sections; arrows point to bleached area at end of photobleaching time (0 s after photobleaching). Bar, 2 μm. (B) Representative FRAP curves (normalized) for PHδ1-GFP at raft patches. (C) Quantitative analysis of FRAP experiments for PHδ1-GFP and ppGFP at raft patches, with or without intact MTs, Sp-cAMPS or Rp-cAMPS. The values are FRAP half-lives; n =15. Asterisks in these experiments indicate that fluorescence did not recover to original values (B, curves), and half-lives are given for plateau values.
Figure 10.
Figure 10.
Proposed role of PI(4,5)P 2 -rich raft assemblies in regulating protrusive motility at the cell surface. (A) Proposed model of how local PI(4,5)P2 metabolism, together with Cdc42, drives the accumulation and dissipation of dynamic PI(4,5)P2-dependent raft-rich patches, which provide signaling platforms for protrusive motility at the cell surface. (B) Proposed model of leading edge motility control through PI(4,5)P2-rich raft assemblies and MTs. MTs captured at raft patches through IQGAP1 target PKA to the leading edge, promoting clustering of raft patches by enhancing PI(4,5)P2 accumulation at patches. This leads to a focusing and polarization of signaling and motility.

Similar articles

Cited by

References

    1. Botelho, R.J., M. Teruel, R. Dierckman, R. Anderson, A. Wells, J.D. York, T. Meyer, and S. Grinstein. 2000. Localized biphasic changes in phosphatidylinositol-4,5-bisphosphate at sites of phagocytosis. J. Cell Biol. 151:1353–1367. - PMC - PubMed
    1. Caroni, P. 2001. Actin cytoskeleton regulation through modulation of PI(4,5)P2 rafts. EMBO J. 20:4332–4336. - PMC - PubMed
    1. Cremona, O., and P. De Camilli. 2001. Phosphoinositides in membrane traffic at the synapse. J. Cell Sci. 114:1041–1052. - PubMed
    1. del Pozo, M.A., N.B. Alderson, W.B. Kiosses, H.-H. Chiang, R.G.W. Anderson, and M.A. Schwartz. 2004. Integrins regulate Rac targeting by internalization of membrane domains. Science. 303:839–842. - PubMed
    1. Etienne-Manneville, S., and A. Hall. 2002. Rho GTPases in cell biology. Nature. 420:629–635. - PubMed

MeSH terms

Substances