. 2005 Apr 11;169(1):167-77.
doi: 10.1083/jcb.200412059. Epub 2005 Apr 4.

Class II fusion protein of alphaviruses drives membrane fusion through the same pathway as class I proteins

Affiliations

Class II fusion protein of alphaviruses drives membrane fusion through the same pathway as class I proteins

Elena Zaitseva et al. J Cell Biol. .

Abstract

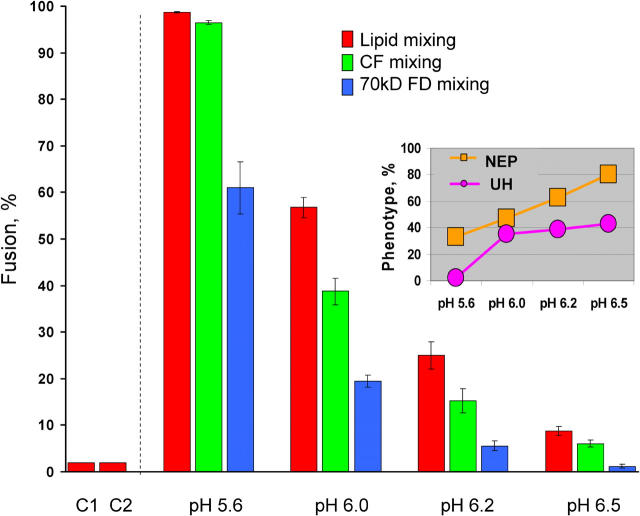
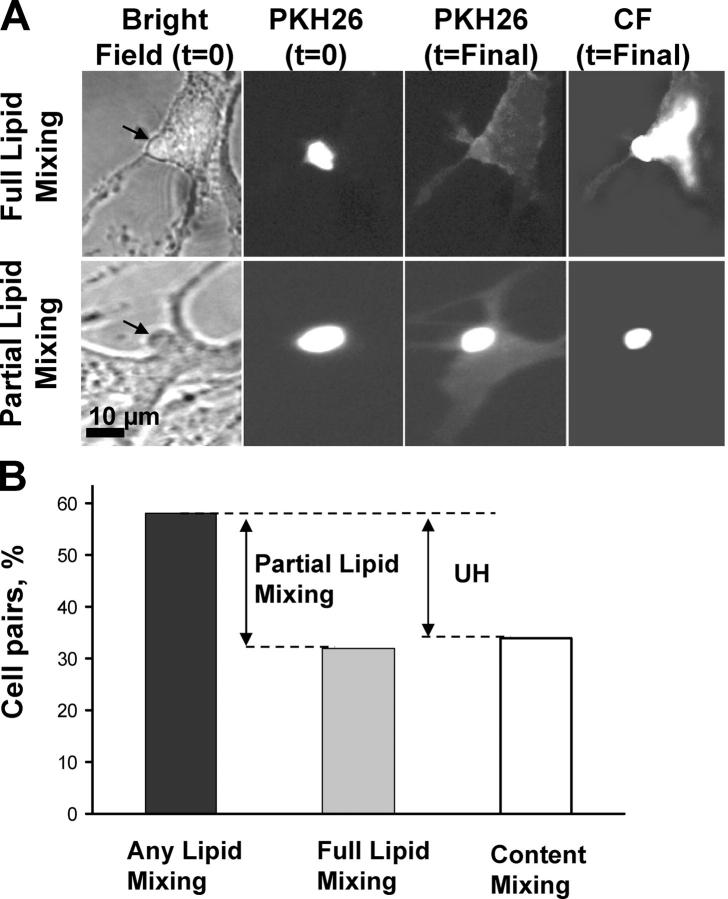
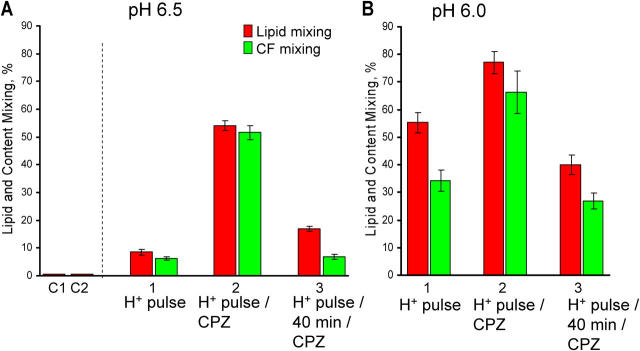
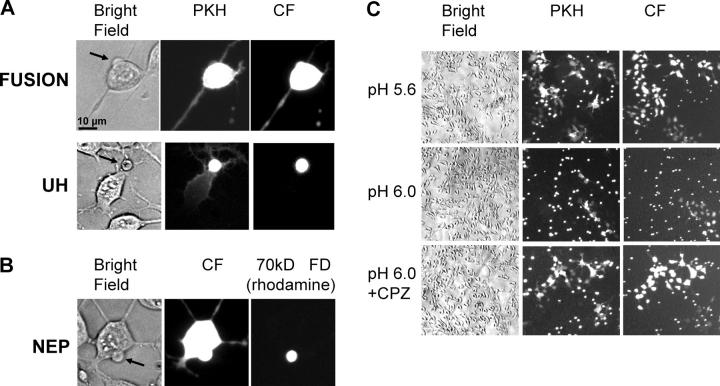
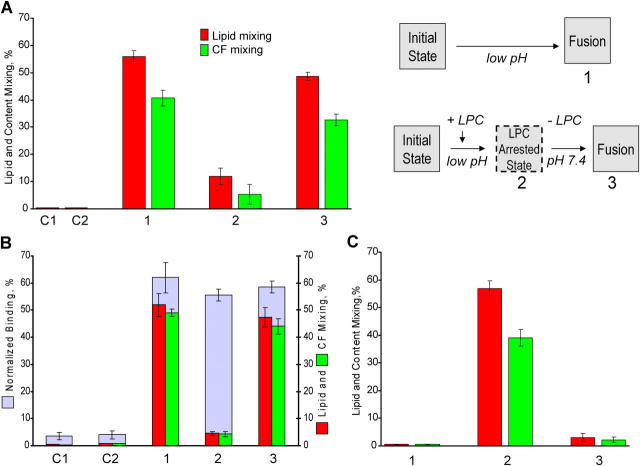
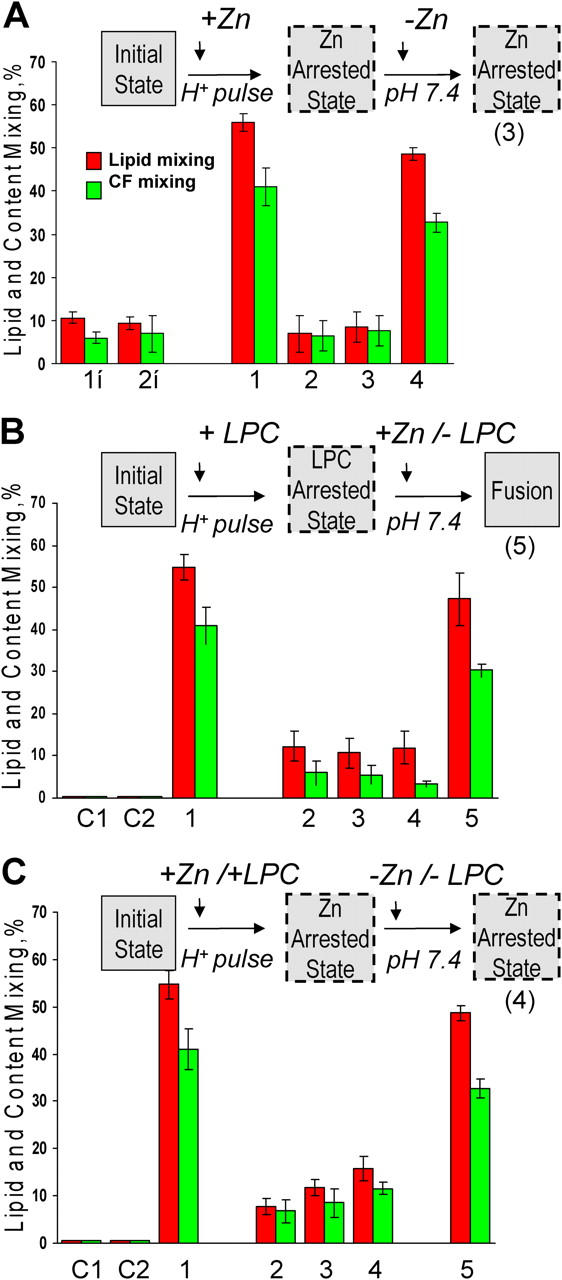
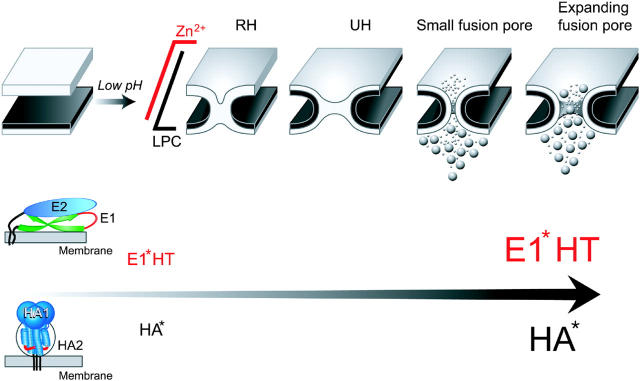
Viral fusion proteins of classes I and II differ radically in their initial structures but refold toward similar conformations upon activation. Do fusion pathways mediated by alphavirus E1 and influenza virus hemagglutinin (HA) that exemplify classes II and I differ to reflect the difference in their initial conformations, or concur to reflect the similarity in the final conformations? Here, we dissected the pathway of low pH-triggered E1-mediated cell-cell fusion by reducing the numbers of activated E1 proteins and by blocking different fusion stages with specific inhibitors. The discovered progression from transient hemifusion to small, and then expanding, fusion pores upon an increase in the number of activated fusion proteins parallels that established for HA-mediated fusion. We conclude that proteins as different as E1 and HA drive fusion through strikingly similar membrane intermediates, with the most energy-intensive stages following rather than preceding hemifusion. We propose that fusion reactions catalyzed by all proteins of both classes follow a similar pathway.


Figures

Figure 1.
Figure 1.
Fusion phenotypes at different pH. Fusion of SIN E1-HAb2 cells with bound PKH26- and CF- or FD-labeled RBCs was triggered by a 5-min application of different pH: pH 5.6, 6.0, 6.2, and 6.5. Here and in other figures final extents of lipid mixing and CF and FD transfer assayed at neutral pH are shown by red, green, and blue bars, respectively. In the control experiments we either did not apply low pH (C1) or replaced SIN E1-HAb2 cells with uninfected HAb2 cells, pH 5.6 (C2). Here and in the subsequent figures bars are mean ± SD, n ≥ 3. The inset shows the relative frequency of UH phenotype among all lipid mixing events and NEP phenotype among all CF mixing events (see Materials and methods) for different pH.
Figure 2.
Figure 2.
Partial lipid mixing in E1 fusion. (A) Bright-field and fluorescent images for two SIN E1-HAb2 cell/RBC pairs represent the two phenotypes of lipid mixing. Bright-field images with RBCs marked by arrows were taken after low pH application. Full lipid mixing (top) is defined by lack of a distinct circular shape of the RBC at the end of the experiment, when dye transfer reaches the saturation (t = Final). Partial lipid mixing (bottom) is defined by incomplete dye transfer with a clear boundary of the initial RBC membrane seen at the time when lipid mixing reaches its saturation. PKH26 fluorescence spreads from RBCs (bright spot at the time the pH is lowered to 6.0, t = 0) to the E1-HAb2 cell (dark at t = 0 and fluorescent at t = Final) upon completion of the lipid mixing event. Right images show CF fluorescence at t = Final. (B) The percentages of E1-HAb2/RBC pairs showing at pH 6.0 any lipid mixing, full lipid mixing, and content (CF) mixing were measured. Cell pairs that show some but not full lipid mixing presented partial lipid mixing phenotype. The percentage of cells with full lipid mixing phenotype is close to the percentage of cells showing CF transfer. The data were collected in four independent experiments. The total number of cell pairs (=100%) in the analysis was 250.
Figure 3.
Figure 3.
RH in SIN E1 fusion. Fusion of SIN E1-HAb2 cells with bound PKH26- and CF-labeled RBCs was triggered by a 5-min pulse of pH 6.5 (A) or pH 6.0 (B). Bars 1: the final extents of lipid and CF mixing. Bars 2 and 3: hemifusion connections were transformed into complete fusion by a 1-min pulse of 0.5 mM CPZ applied immediately after the low pH pulse (bars 2) or with a 40 min delay (bars 3). No lipid mixing was observed when CPZ was applied to E1-HAb2/RBC pairs not exposed to acidic pH (C1) or to low-pH–treated noninfected HAb2 cells with bound RBCs (C2).
Figure 4.
Figure 4.
RH and UH phenotypes and nonexpanding fusion pores in SFV E1 fusion. (A) Bright-field and fluorescent images for two SFV E1-HAb2 cell/RBC pairs after 5-min pulse of pH 6.0 represent the two phenotypes of lipid mixing: full lipid mixing correlated with content mixing (“fusion” in top panel) and partial lipid mixing correlated with UH (bottom panel). Spreading of the PKH26 and CF fluorescence from RBCs (marked by arrow in bright-field image) to the E1-HAb2 cell is shown upon completion of the lipid mixing event. (B) NEP phenotype observed in fusion between RBCs doubly labeled with CF and 70-kD RFD and bound SFV E1-HAb2 cell. Aqueous connection between the cells allows transfer of CF but not 70-kD RFD. (C) Low magnification images (bright field, PKH26- and CF-fluorescence) of SFV E1-HAb2 cells with bound RBCs treated with 5-min pulse of pH 5.6 or 6.0 (top and middle panels, respectively). Bottom panel shows the field of view for SFV E1-HAb2 cells with bound RBCs treated with 5-min pulse of pH 6.0 and then treated with a CPZ pulse to transform RH into complete fusion.
Figure 5.
Figure 5.
LAS that follows all low pH–dependent stages of E1 restructuring and precedes actual membrane fusion. (A) Cartoon to the right illustrates the experimental protocol and our finding that LPC reversibly arrested fusion downstream low pH–dependent stages. Fusion between SIN E1-HAb2 cells and bound RBCs was triggered by a 5-min pulse of pH 6.0 and assayed as lipid and CF mixing. Bars 1: No LPC added; Bars 2: starting 5 min before the low pH pulse and throughout the entire experiment, cell pairs were incubated in the presence of 70 μM lauroyl LPC. Bars 3: LPC was washed out by LPC-free PBS 15 min after the end of low pH application. In the control experiments we applied and then removed LPC to E1-HAb2/RBC pairs that had not been treated with a low pH pulse (C1); or applied a low pH pulse in the presence of LPC to uninfected HAb2 cells with bound RBCs and then washed out LPC (C2). (B) SIN-infected BHK21 cells with loosely attached RBCs were treated with a 5-min pH 6.0 pulse in the absence (bars 1) or in the presence of 70 μM lauroyl LPC (bars 2 and 3). Low pH buffer was replaced with LPC-free PBS (bars 3) or with PBS supplemented with 70 μM LPC (bars 2). In parallel with fusion assay we counted the number of RBCs that remained associated with the E1-expressing cells after robust washes (shown by light blue bars). This low-pH– and E1-dependent binding most likely reflects insertion of an E1 FL into the RBC membrane. Bars C1 and C2: control experiments similar to the experiments shown by bars 1 but for noninfected BHK21 cells (C1) and for SIN-infected BHK21 cells with omitted low pH application (C2). These controls show the level of binding in the absence of the low pH–activated E1 insertion. (C) Stearoyl LPC added exclusively to E1-expressing membrane inhibits its fusion with RBCs. Bars 2: in the control experiment with no LPC added fusion between SIN E1-HAb2 cells and bound RBCs was triggered by a 5-min application of pH 6.0 buffer. Bars 3: SIN E1-HAb2 cells were pretreated with 5 μM stearoyl LPC. After washing out unbound LPC the cells were brought in contact with RBCs. As in (2) fusion was triggered by a 5-min application of pH 6.0 buffer. Bars 1: control experiment similar to that shown by bars 3 but with omitted low pH application.
Figure 6.
Figure 6.
ZnAS precedes LAS. In these experiments we took advantage of the rapidness with which E1 fusion reaches its final extents under given conditions. Collecting video microscopy images for subsequent analysis and scoring fusion at several points in the experimental protocol (for instance, before and after removal of an inhibitor) allowed us to assay fusion extents for E1-HAb2 cells with bound RBCs under several conditions in the same dish rather than in independent experiments. Cartoons above A, B, and C illustrate the main finding of each figure. (A) Low pH application in the presence of Zn yields an arrested fusion stage, where E1 is neither irreversibly inactivated nor committed to fusion upon Zn removal. In the control experiment E1-HAb2 cells with bound RBCs were treated by a 5-min pH 6.0 pulse in the absence of Zn (bars 1). In the experiment on Zn inhibition (bars 2–4) fusion was first measured at the end of a 5-min pH 6.0 application in the presence of 5 mM Zn (bars 2). Fusion was next assayed after the cells were reneutralized and Zn removed (bars 3). The cells were treated by a second 5-min pH 6.0 pulse, and fusion was measured again (bars 4). The lack of E1 inactivation observed in this experiment is contrasted with the E1 inactivation observed when low pH was applied in the absence of the target membrane with or without Zn (bar 1i and 2i, respectively). SIN E1-HAb2 cells were treated with a 5-min pulse of pH 6.0, reneutralized, and incubated with RBCs for 15 min. Then, a second 5-min pulse of pH 6.0 was applied. Functional inactivation of E1 due to the first low pH pulse lowered fusion extents observed after the second pulse. (B) Fusion downstream of the LPC-arrested state is already insensitive to Zn. In the control experiment (bars 1) E1-HAb2 cells with bound RBCs were treated by a 10-min pH 6.0 pulse in the absence of fusion inhibitors. In the experiment shown in bars 2–5, E1-HAb2 cells with bound RBCs were incubated with lauroyl LPC for 5 min. Then, still in the presence of 70 μM lauroyl LPC, the cells were incubated for 5 min at pH 6.0. After taking video microscopy images for subsequent quantification (bars 2) the buffer was replaced by the pH 6.0 buffer supplemented with LPC and Zn. Thus the cells, while still kept at acidic pH and in the presence of LPC, were now exposed to Zn. After 5 min incubation we again measured fusion (bars 3). The cells were reneutralized still in the presence of LPC and Zn and fusion was measured again (bars 4). Finally, we removed LPC and assayed fusion at pH 7.4 still in the presence of Zn (bars 5). The control experiments shown in bars C1 and C2 were similar to that shown by bars 5, but we either omitted low pH application (C1) or replaced E1-HAb2 cells with noninfected HAb2 cells (C2). (C) SIN E1-HAb2 cells with bound RBCs acidified in the presence of both Zn and LPC do not reach LPC-arrested stage. In the control experiment E1-HAb2 cells with bound RBCs were treated by a 5-min pH 6.0 pulse in the absence of fusion inhibitors (bars 1). In the experiment shown in bars 2–5, E1-HAb2 cells with bound RBCs were incubated with both lauroyl LPC and Zn for 5 min at neutral pH. After taking video microscopy images for subsequent quantification, the cells were treated with a 5-min pulse of pH 6.0 still in the presence of both LPC and Zn. Fusion was quantified (bars 2) and then again assayed after reneutralization of the cells (bars 3) and removal of both LPC and Zn (bars 4). Bars 5: the cells were treated with a second 5-min pH 6.0 pulse, and fusion was measured again. The control experiments shown in bars C1 and C2 were similar to that shown by bars 4 but we either omitted low pH application (C1) or replaced E1-HAb2 cells with noninfected HAb2 cells (C2).
Figure 7.
Figure 7.
The progression of fusion phenotypes upon an increase in the number of activated fusion proteins. In the schematic diagram of the fusion site, the top and bottom membranes represent a section of a fusion protein-expressing membrane and a section of a prelabeled target cell membrane, respectively. Acidification initiates restructuring of E1 and HA from very different initial conformations (see the text). Upon increase in the number of low pH–activated fusion proteins the observed fusion phenotype shifts from an initial state with two apposing membranes, to restricted hemifusion, RH, and then to unrestricted hemifusion, UH. The transfer of the lipid probe from the target cell membrane through the fusion site is first detected at UH. At still higher numbers of activated proteins E1* and HA* fusion phenotype advances beyond transient hemifusion phenotypes to an opening of a small fusion pore and, finally, to an irreversible expansion of the fusion pore. Transfer of small and large aqueous probes preloaded into target cell proceeds only upon formation of small and expanding fusion pores, respectively. LAS follows a trigger-dependent activation of fusion proteins and precedes the actual membrane merger. This sequence of fusion phenotypes is conserved between class I and class II fusion proteins. ZnAS, specific for E1-fusion, precedes formation of functional E1 homotrimers (E1* HT) and LPC-arrested stage.

Similar articles

Cited by

References

    1. Bentz, J. 2000. Minimal aggregate size and minimal fusion unit for the first fusion pore of influenza hemagglutinin-mediated membrane fusion. Biophys. J. 78:227–245. - PMC - PubMed
    1. Blumenthal, R., D.P. Sarkar, S. Durell, D.E. Howard, and S.J. Morris. 1996. Dilation of the influenza hemagglutinin fusion pore revealed by the kinetics of individual cell–cell fusion events. J. Cell Biol. 135:63–71. - PMC - PubMed
    1. Borrego-Diaz, E., M.E. Peeples, R.M. Markosyan, G.B. Melikyan, and F.S. Cohen. 2003. Completion of trimeric hairpin formation of influenza virus hemagglutinin promotes fusion pore opening and enlargement. Virology. 316:234–244. - PubMed
    1. Bressanelli, S., K. Stiasny, S.L. Allison, E.A. Stura, S. Duquerroy, J. Lescar, F.X. Heinz, and F.A. Rey. 2004. Structure of a flavivirus envelope glycoprotein in its low-pH-induced membrane fusion conformation. EMBO J. 23:728–738. - PMC - PubMed
    1. Bron, R., J.M. Wahlberg, H. Garoff, and J. Wilschut. 1993. Membrane fusion of Semliki Forest virus in a model system: correlation between fusion kinetics and structural changes in the envelope glycoprotein. EMBO J. 12:693–701. - PMC - PubMed

Publication types

Substances