. 2005 Mar;2(1):4-19.
doi: 10.1186/1479-7364-2-1-4.

Impact of human population history on distributions of individual-level genetic distance

Affiliations

Impact of human population history on distributions of individual-level genetic distance

Joanna L Mountain et al. Hum Genomics. 2005 Mar.

Abstract

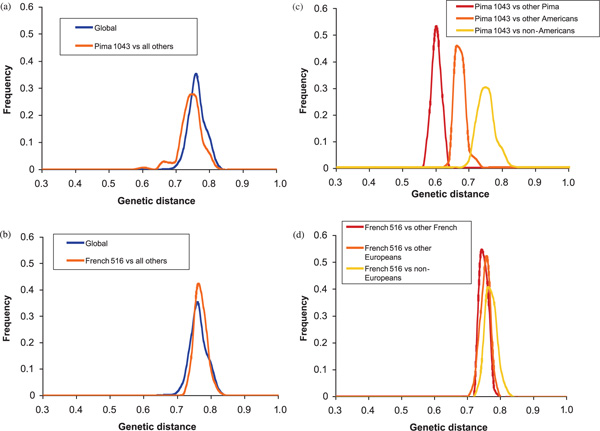
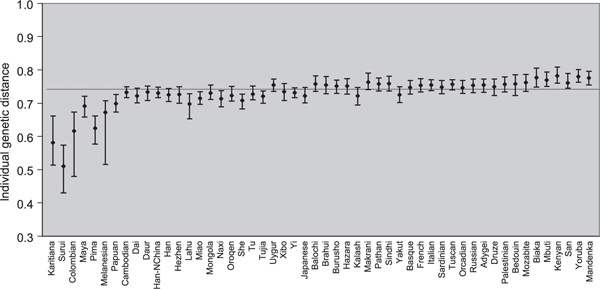
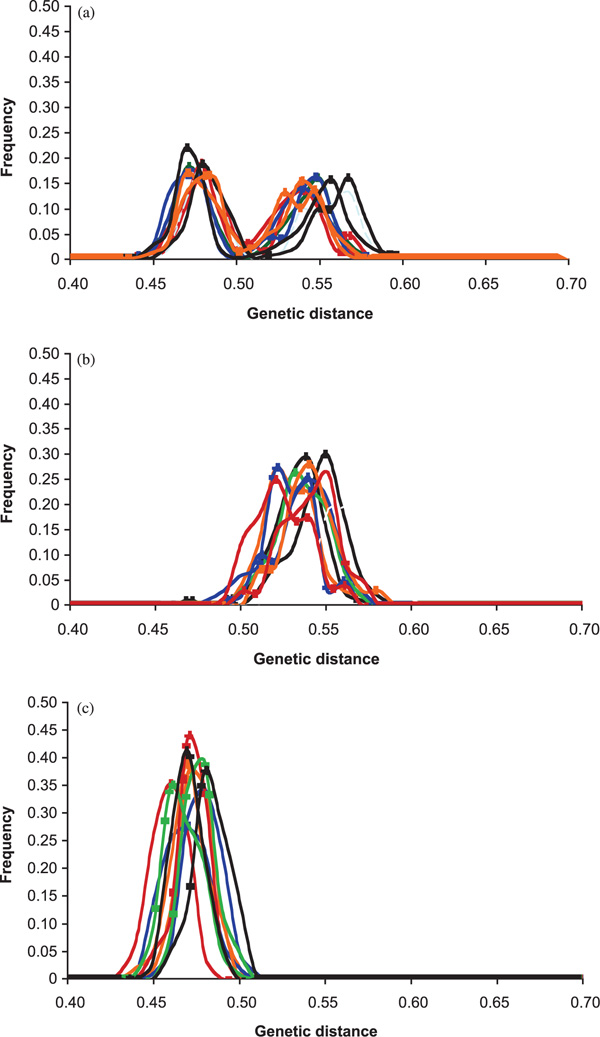
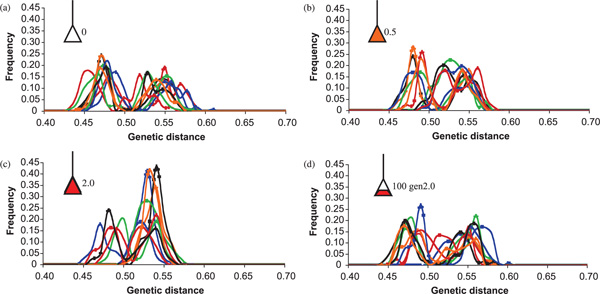
Summaries of human genomic variation shed light on human evolution and provide a framework for biomedical research. Variation is often summarised in terms of one or a few statistics (eg F(ST) and gene diversity). Now that multilocus genotypes for hundreds of autosomal loci are available for thousands of individuals, new approaches are applicable. Recently, trees of individuals and other clustering approaches have demonstrated the power of an individual-focused analysis. We propose analysing the distributions of genetic distances between individuals. Each distribution, or common ancestry profile (CAP), is unique to an individual, and does not require a priori assignment of individuals to populations. Here, we consider a range of models of population history and, using coalescent simulation, reveal the potential insights gained from a set of CAPs. Information lies in the shapes of individual profiles--sometimes captured by variance of individual CAPs--and the variation across profiles. Analysis of short tandem repeat genotype data for over 1,000 individuals from 52 populations is consistent with dramatic differences in population histories across human groups.


Figures

Figure 1
Figure 1
Common ancestry profiles for two individuals, based on genotype data for 377 short tandem repeat (STR) loci[4]. Distribution of genetic distance estimates for all possible pairs drawn from 1,013 individuals of the CEPH-HGDP STR dataset (overall) and for all pairs including individual Pima1043 or French 516. (a) Pima 1043 vs all other individuals; (b) French 516 vs all other individuals; (c) Pima 1043 vs three sets of individuals: other Pima, other non-Pima Americans and all non-Americans of CEPH-HGDP set; (d) French 516 vs three sets of individuals: other French, non-French Europeans and non-Europeans. Genetic distance for a pair of individuals is defined as the probability with which two alleles, one drawn randomly from each of the two individuals, differ in state, averaged across loci. Forty-three individuals (13 duplicates and 30 close relatives) excluded from original Rosenberg dataset [4].
Figure 2
Figure 2
Summary of common ancestry profiles for 52 human populations. Mean genetic distance (d ^xy) among individuals within each of 52 human populations of the CEPH-HGDP panel, with range indicated by the 5th to 95th percentiles. Genetic distance of individuals x and y reflects the probability that two short tandem repeat alleles drawn, one from x and one from y at a particular locus, differ in state. The horizontal dotted line indicates average genetic distance (0.74) for all within-population comparisons.
Figure 3
Figure 3
Ten examples each of simulated common ancestry profiles (CAPs) comparing an individual to: (a) all other individuals in two populations ('overall'); (b) all other individuals in the same population ('between'); and (c) all others in a different population ('within'). CAPs derived from coalescent simulations of two populations of effective size 1,000 that diverged 2,000 generations ago, generating 500 short tandem repeat loci (mutation rate: 0.0005/locus/generation; range constraint: 15, stepwise mutation model).
Figure 4
Figure 4
Ten examples of common ancestry profiles (CAPs) generated under each of four models of population history. Each 'cryptic' comparison set is based on 100 samples randomly selected from 200 possible samples in both populations, as might be realistic in the case of cryptic population structure. CAPs derived from coalescent simulations of two populations of effective size 1,000 that diverged 2,000 generations ago given: (a) complete isolation; (b) continuous gene flow at the rate of 0.5 migrants per generation; (c) continuous gene flow at the rate of 2.0 migrants per generation; and (d) gene flow over the past 100 generations at the rate of 2.0 migrant per generation, following 1,900 generations of isolation. Gene flow is asymmetrical. CAPs derived from simulated data for 500 short tandem repeat loci (mutation rate: 0.0005/locus/generation, range constraint: 15, stepwise mutation model).
Figure 5
Figure 5
Common ancestry profiles (CAPs) for four individuals in the context of four pairs of populations, including geographically proximate populations, (a) Surui/Karitiana and (b) Burusho/Kalash, and geographically distant populations, (c) Pima/Mbuti and (d) Papuan/Biaka. Each figure illustrates a 'within', 'between' and 'overall' CAP for a focal individual. For example, the Surui/Karatiana comparison illustrates: (1) a Surui individual versus other Surui; (2) a Surui individual versus all Karitiana individuals; and (3) a Surui individual versus all Karitiana and all other Surui individuals.

References

    1. Cavalli-Sforza LL, Piazza A, Menozzi P. History and Geography of Human Genes. Princeton University Press, Princeton, NJ; 1994.
    1. Salas A, Richards M, De la Fe T. et al.The making of the African mtDNA landscape. Am J Hum Genet. 2002;71:1082–1111. doi: 10.1086/344348. - DOI - PMC - PubMed
    1. Underhill PA, Passarino G, Lin AA. et al.The phylogeography of Y chromosome binary haplotypes and the origins of modern human populations. Ann Hum Genet. 2001;65:43–62. doi: 10.1046/j.1469-1809.2001.6510043.x. - DOI - PubMed
    1. Rosenberg NA, Pritchard JK, Weber JL. et al.Genetic structure of human populations. Science. 2002;298:2381–2385. doi: 10.1126/science.1078311. - DOI - PubMed
    1. Pritchard JK, Stephens M, Donnelly P. Inference of population structure using multilocus genotype data. Genetics. 2000;155:945–959. - PMC - PubMed

Publication types

LinkOut - more resources