. 2005 Feb 28;360(1454):255-68.
doi: 10.1098/rstb.2004.1583.

Using Red List Indices to measure progress towards the 2010 target and beyond

Affiliations

Using Red List Indices to measure progress towards the 2010 target and beyond

S H M Butchart et al. Philos Trans R Soc Lond B Biol Sci. .

Abstract

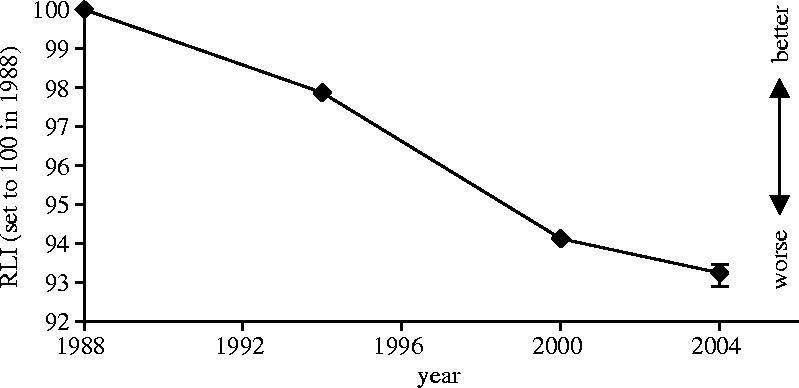
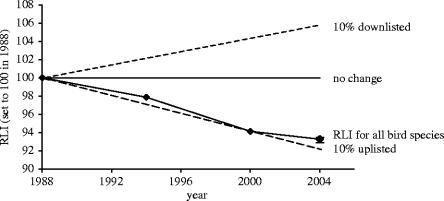
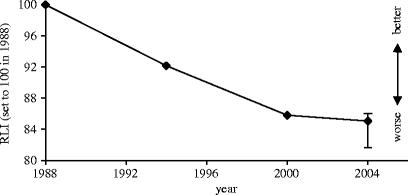
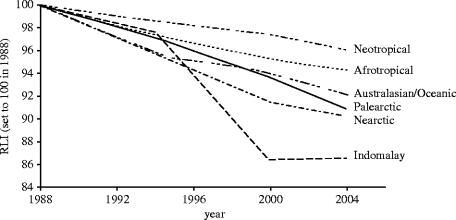
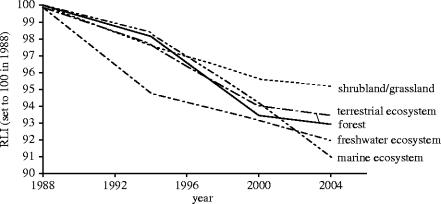
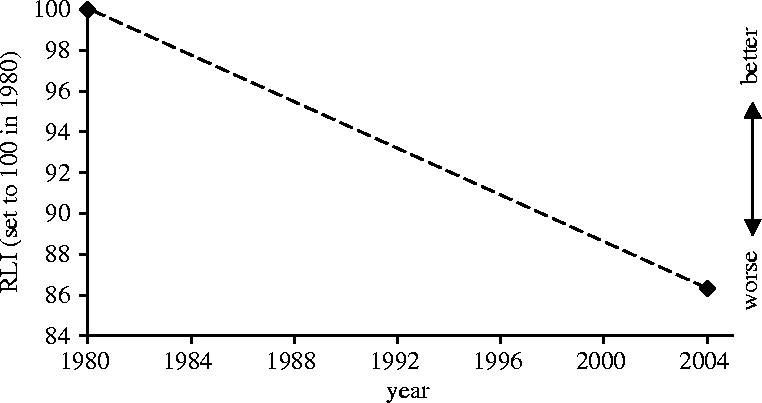
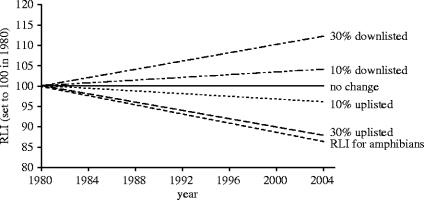
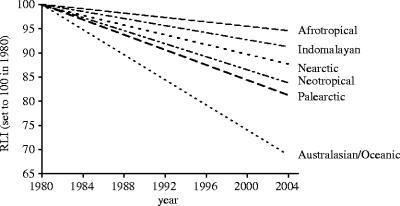
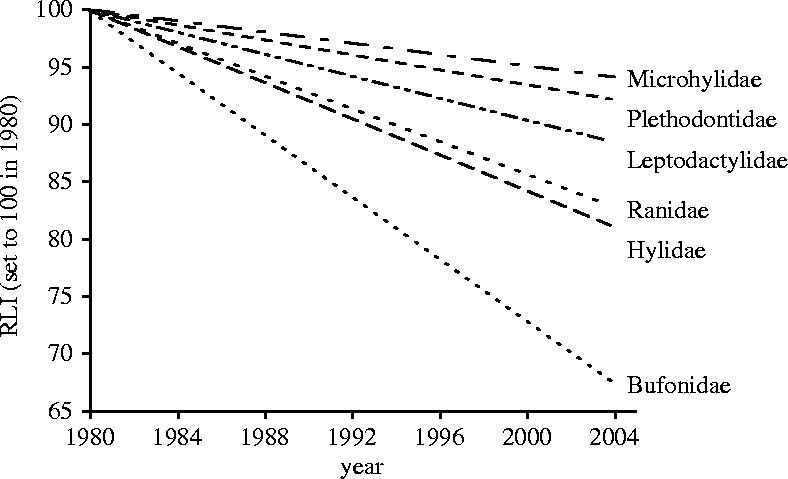
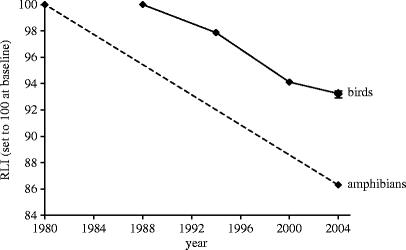
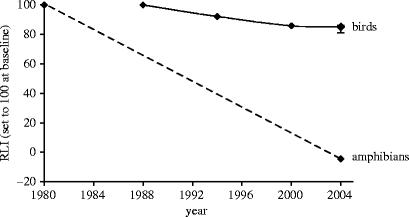
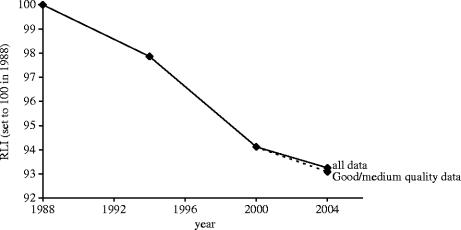
The World Conservation Union (IUCN) Red List is widely recognized as the most authoritative and objective system for classifying species by their risk of extinction. Red List Indices (RLIs) illustrate the relative rate at which a particular set of species change in overall threat status (i.e. projected relative extinction-risk), based on population and range size and trends as quantified by Red List categories. RLIs can be calculated for any representative set of species that has been fully assessed at least twice. They are based on the number of species in each Red List category, and the number changing categories between assessments as a result of genuine improvement or deterioration in status. RLIs show a fairly coarse level of resolution, but for fully assessed taxonomic groups they are highly representative, being based on information from a high proportion of species worldwide. The RLI for the world's birds shows that that their overall threat status has deteriorated steadily during the years 1988-2004 in all biogeographic realms and ecosystems. A preliminary RLI for amphibians for 1980-2004 shows similar rates of decline. RLIs are in development for other groups. In addition, a sampled index is being developed, based on a stratified sample of species from all major taxonomic groups, realms and ecosystems. This will provide extinction-risk trends that are more representative of all biodiversity.


Figures

Figure 1
Figure 1
The Red List Index for all bird species, 1988–2004 (n=250 genuine status changes/2469 species in categories extinct in the wild to near threatened, in at least one assessment). Error bars for 2004 RLI value based on estimated number of genuine status changes for 2000–2004 not yet detected owing to information time-lags (see text for further details).
Figure 2
Figure 2
The Red List Index for all bird species, 1988–2004 (n=250/2469 species), with hypothetical indices showing trends if zero species had changed category, and if 10% of species in the categories from near threatened to critically endangered had been up-listed to a higher category of threat or down-listed to a lower category of threat over the period.
Figure 3
Figure 3
The Red List Index weighted by extinction-risk for all bird species, 1988–2004 (n=250 genuine status changes/2469 species in categories extinct in the wild to near threatened, in at least one assessment). Error bars for 2004 RLI value based on estimated number of genuine status changes for 2000–2004 not yet detected owing to information time-lags (see text for further details).
Figure 4
Figure 4
Red List Indices for birds for 1988–2004 in different biogeographic realms. Sample sizes: Afrotropical=41 genuine status changes/394 species in categories extinct in the wild to near threatened, in at least one assessment; Indomalay=100/585, Nearctic=9/92, Neotropical=49/834, Australasian/Oceanic=53/614, Palaearctic=34/238.
Figure 5
Figure 5
Red List Indices for birds for 1988–2004 in the marine, freshwater and terrestrial ecosystems, and for birds in forest and shrubland/grassland habitats. Sample sizes: marine=12 genuine status changes/133 species in categories extinct in the wild to near threatened, in at least one assessment; freshwater=31/226, terrestrial=206/2329, forest=169/1513, shrubland/grassland=45/481.
Figure 6
Figure 6
A preliminary Red List Index for all amphibian species for 1980–2004 (retrospectively assessed; n=496 genuine status changes/2225 species in categories extinct in the wild to near threatened, in at least one assessment; 1294 data deficient/5709 extant species).
Figure 7
Figure 7
A preliminary Red List Index for all amphibian species for 1980–2004 (retrospectively assessed; n=496/2225 species), with hypothetical indices showing trends if zero species had changed category, and if 10 or 30% of species in the categories from near threatened to critically endangered had been up-listed to a higher category of threat or down-listed to a lower category of threat over the period.
Figure 8
Figure 8
Preliminary Red List Indices for amphibians for 1980–2004 (retrospectively assessed) in different biogeographic realms. Sample sizes: Afrotropical=29 genuine status changes/287 species in categories extinct in the wild to near threatened, in at least one assessment (205 data deficient/951 extant species); Indo-Malayan=60/399 species (226 DD/917 extant species); Nearctic=29/118 species (22 DD/329 extant species); Neotropical=332/1260 species (628 DD/2818 extant species); Australasian/Oceanic=38/88 species (177 DD/558 extant species); Palaearctic=36/148 species (55 DD/450 extant species).
Figure 9
Figure 9
Preliminary Red List Indices for selected amphibian families for 1980–2004 (retrospectively assessed). Sample sizes: Bufonidae: 106 genuine status changes/233 species in categories extinct in the wild to near threatened, in at least one assessment (59 data deficient/456 extant species); Leptodactylidae: 121/584 species (220 DD/1122 extant species); Hylidae: 68/241 species (171 DD/856 extant species); Ranidae: 56/222 species (132 DD/648 extant species); Microhylidae: 10/89 species (153 DD/413 extant species); Plethodontidae: 34/204 species (54 DD/347 extant species).
Figure 10
Figure 10
The Red List Index for all bird species for 1988–2004 and a preliminary Red List Index for all amphibians for 1980–2004 (retrospective assessment). Sample sizes: birds: n=250 genuine status changes/2469 species in categories extinct in the wild to near threatened, in at least one assessment; amphibians: n=496/2225 species; 1294 data deficient/5709 extant species.
Figure 11
Figure 11
The Red List Index weighted by extinction-risk for all bird species for 1988–2004 and a preliminary Red List Index weighted by extinction-risk for all amphibian species for 1980–2004 (retrospective assessment). Sample sizes: birds: n=250 genuine status changes/2469 species in categories extinct in the wild to near threatened, in at least one assessment; amphibians: n=496/2225 species; 1294 data deficient/5709 extant species.
Figure 12
Figure 12
The Red List Index for all bird species, 1988–2004 (n=250 genuine status changes/2469 species in categories extinct in the wild to near threatened, in at least one assessment), and the RLI calculated for 2000–2004 based only on species with high quality data (n=45 genuine status changes in 2000–2004/701 species in categories extinct in the wild to near threatened in 2000 and/or 2004).

Similar articles

Cited by

  • The dominance-diversity dilemma in animal conservation biology.
    Martin CA, Watson CJ, de Grandpré A, Desrochers L, Deschamps L, Giacomazzo M, Loiselle A, Paquette C, Pépino M, Rainville V, Rheault G, Proulx R. Martin CA, et al. PLoS One. 2023 Mar 27;18(3):e0283439. doi: 10.1371/journal.pone.0283439. eCollection 2023. PLoS One. 2023. PMID: 36972282 Free PMC article.
  • Measuring trends in extinction risk: a review of two decades of development and application of the Red List Index.
    Butchart SHM, Akçakaya HR, Berryman AJ, Brooks TM, Burfield IJ, Chanson J, Dias MP, Donaldson JS, Hermes C, Hilton-Taylor C, Hoffmann M, Luedtke JA, Martin R, McDougall A, Neam K, Polidoro B, Raimondo D, Rodrigues ASL, Rondinini C, Rutherford C, Scott T, Simkins AT, Stuart SN, Vine J. Butchart SHM, et al. Philos Trans R Soc Lond B Biol Sci. 2025 Jan 9;380(1917):20230206. doi: 10.1098/rstb.2023.0206. Epub 2025 Jan 9. Philos Trans R Soc Lond B Biol Sci. 2025. PMID: 39780598 Free PMC article. Review.
  • Green Plants in the Red: A Baseline Global Assessment for the IUCN Sampled Red List Index for Plants.
    Brummitt NA, Bachman SP, Griffiths-Lee J, Lutz M, Moat JF, Farjon A, Donaldson JS, Hilton-Taylor C, Meagher TR, Albuquerque S, Aletrari E, Andrews AK, Atchison G, Baloch E, Barlozzini B, Brunazzi A, Carretero J, Celesti M, Chadburn H, Cianfoni E, Cockel C, Coldwell V, Concetti B, Contu S, Crook V, Dyson P, Gardiner L, Ghanim N, Greene H, Groom A, Harker R, Hopkins D, Khela S, Lakeman-Fraser P, Lindon H, Lockwood H, Loftus C, Lombrici D, Lopez-Poveda L, Lyon J, Malcolm-Tompkins P, McGregor K, Moreno L, Murray L, Nazar K, Power E, Quiton Tuijtelaars M, Salter R, Segrott R, Thacker H, Thomas LJ, Tingvoll S, Watkinson G, Wojtaszekova K, Nic Lughadha EM. Brummitt NA, et al. PLoS One. 2015 Aug 7;10(8):e0135152. doi: 10.1371/journal.pone.0135152. eCollection 2015. PLoS One. 2015. PMID: 26252495 Free PMC article.
  • The loss of species: mangrove extinction risk and geographic areas of global concern.
    Polidoro BA, Carpenter KE, Collins L, Duke NC, Ellison AM, Ellison JC, Farnsworth EJ, Fernando ES, Kathiresan K, Koedam NE, Livingstone SR, Miyagi T, Moore GE, Ngoc Nam V, Ong JE, Primavera JH, Salmo SG, Sanciangco JC, Sukardjo S, Wang Y, Yong JW. Polidoro BA, et al. PLoS One. 2010 Apr 8;5(4):e10095. doi: 10.1371/journal.pone.0010095. PLoS One. 2010. PMID: 20386710 Free PMC article.
  • Accounting for imperfect detection is critical for inferring marine turtle nesting population trends.
    Pfaller JB, Bjorndal KA, Chaloupka M, Williams KL, Frick MG, Bolten AB. Pfaller JB, et al. PLoS One. 2013 Apr 24;8(4):e62326. doi: 10.1371/journal.pone.0062326. Print 2013. PLoS One. 2013. PMID: 23638041 Free PMC article.

References

    1. BirdLife International. BirdLife International and Lynx Edicions; Cambridge, UK: 2000. Threatened birds of the world.
    1. BirdLife International. BirdLife International; Cambridge, UK: 2001. Threatened birds of Asia: the BirdLife International Red Data Book.
    1. BirdLife International. BirdLife International; Cambridge, UK: 2004a. Threatened birds of the world 2004. CD-ROM.
    1. BirdLife International. BirdLife International; Cambridge, UK: 2004b. State of the worlds birds 2004: indicators for our changing planet.
    1. BirdLife International. 2004. Globally threatened bird update. See http://www.birdlife.org/action/science/species/globally_tbu/index.html.

LinkOut - more resources