

Reaction coordinates and rates from transition paths
- PMID: 15814618
- PMCID: PMC1100744
- DOI: 10.1073/pnas.0408098102
Reaction coordinates and rates from transition paths
Abstract
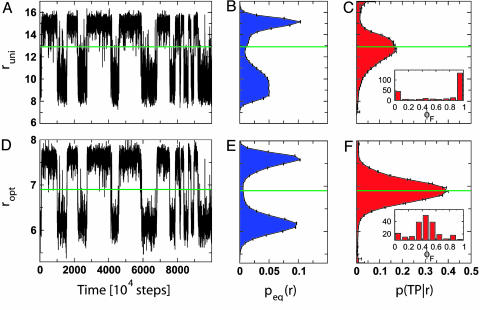
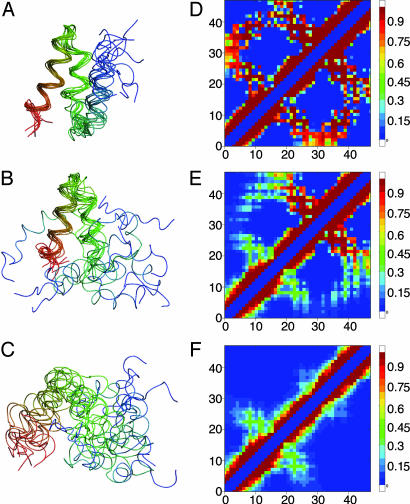
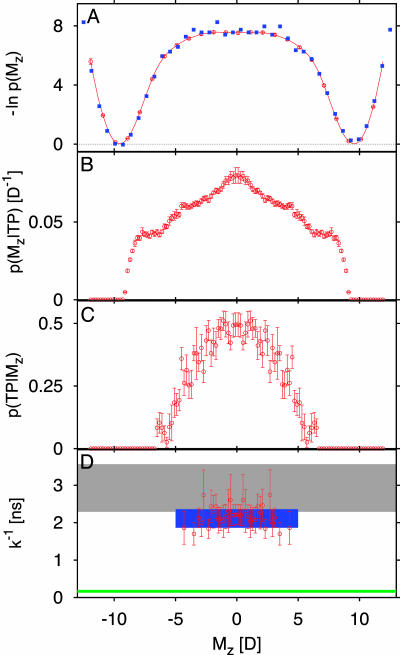
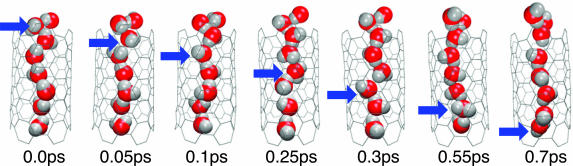
The molecular mechanism of a reaction in solution is reflected in its transition-state ensemble and transition paths. We use a Bayesian formula relating the equilibrium and transition-path ensembles to identify transition states, rank reaction coordinates, and estimate rate coefficients. We also introduce a variational procedure to optimize reaction coordinates. The theory is illustrated with applications to protein folding and the dipole reorientation of an ordered water chain inside a carbon nanotube. To describe the folding of a simple model of a three-helix bundle protein, we variationally optimize the weights of a projection onto the matrix of native and nonnative amino acid contacts. The resulting one-dimensional reaction coordinate captures the folding transition state, with formation and packing of helix 2 and 3 constituting the bottleneck for folding.
Figures
Similar articles
-
Native contacts determine protein folding mechanisms in atomistic simulations.Proc Natl Acad Sci U S A. 2013 Oct 29;110(44):17874-9. doi: 10.1073/pnas.1311599110. Epub 2013 Oct 15. Proc Natl Acad Sci U S A. 2013. PMID: 24128758 Free PMC article.
-
Transition paths, diffusive processes, and preequilibria of protein folding.Proc Natl Acad Sci U S A. 2012 Dec 18;109(51):20919-24. doi: 10.1073/pnas.1209891109. Epub 2012 Dec 3. Proc Natl Acad Sci U S A. 2012. PMID: 23213246 Free PMC article.
-
Kinetic pathways of beta-hairpin (un)folding in explicit solvent.Biophys J. 2005 Jan;88(1):50-61. doi: 10.1529/biophysj.104.048744. Epub 2004 Oct 29. Biophys J. 2005. PMID: 15516524 Free PMC article.
-
Transition-path sampling of beta-hairpin folding.Proc Natl Acad Sci U S A. 2003 Oct 14;100(21):12129-34. doi: 10.1073/pnas.1534924100. Epub 2003 Oct 1. Proc Natl Acad Sci U S A. 2003. PMID: 14523242 Free PMC article.
-
Carbon nanotube-based functional materials for optical limiting.J Nanosci Nanotechnol. 2007 Apr-May;7(4-5):1268-83. doi: 10.1166/jnn.2007.308. J Nanosci Nanotechnol. 2007. PMID: 17450890 Review.
Cited by
-
Protein dynamics and the enzymatic reaction coordinate.Top Curr Chem. 2013;337:189-208. doi: 10.1007/128_2012_412. Top Curr Chem. 2013. PMID: 23508766 Free PMC article. Review.
-
Behavior of Proteins under Pressure from Experimental Pressure-Dependent Structures.J Phys Chem B. 2021 Jun 17;125(23):6179-6191. doi: 10.1021/acs.jpcb.1c03313. Epub 2021 Jun 8. J Phys Chem B. 2021. PMID: 34100621 Free PMC article.
-
Investigating the trade-off between folding and function in a multidomain Y-family DNA polymerase.Elife. 2020 Oct 20;9:e60434. doi: 10.7554/eLife.60434. Elife. 2020. PMID: 33079059 Free PMC article.
-
Transient probability currents provide upper and lower bounds on non-equilibrium steady-state currents in the Smoluchowski picture.J Chem Phys. 2019 Nov 7;151(17):174108. doi: 10.1063/1.5120511. J Chem Phys. 2019. PMID: 31703496 Free PMC article.
-
Microscopic events in β-hairpin folding from alternative unfolded ensembles.Proc Natl Acad Sci U S A. 2011 Jul 5;108(27):11087-92. doi: 10.1073/pnas.1016685108. Epub 2011 Jun 20. Proc Natl Acad Sci U S A. 2011. PMID: 21690352 Free PMC article.
References
-
- Zwanzig, R. (2001) Nonequilibrium Statistical Mechanics (Oxford Univ. Press, New York).
-
- Berne, B. J. & Pecora, R. (1976) Dynamic Light Scattering (Wiley, New York).
-
- Chandler, D. (1978) J. Chem. Phys. 68, 2959–2970.
-
- Berne, B. J., Borkovec, M. & Straub, J. E. (1988) J. Phys. Chem. 92, 3711–3725.
-
- Hänggi, P., Talkner, P. & Borkovec, M. (1990) Rev. Mod. Phys. 62, 251–341.
MeSH terms
Substances
LinkOut - more resources
Full Text Sources
Other Literature Sources
