Comparative Study
. 2005 Apr 6;25(14):3489-98.
doi: 10.1523/JNEUROSCI.0597-05.2005.

A functional role for small-conductance calcium-activated potassium channels in sensory pathways including nociceptive processes

Affiliations
Comparative Study

A functional role for small-conductance calcium-activated potassium channels in sensory pathways including nociceptive processes

Parmvir K Bahia et al. J Neurosci. .

Abstract

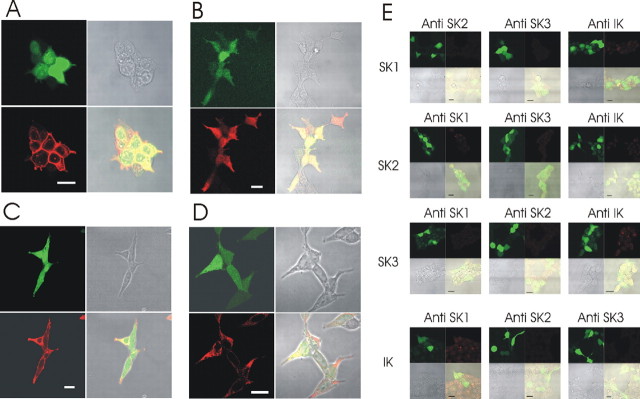
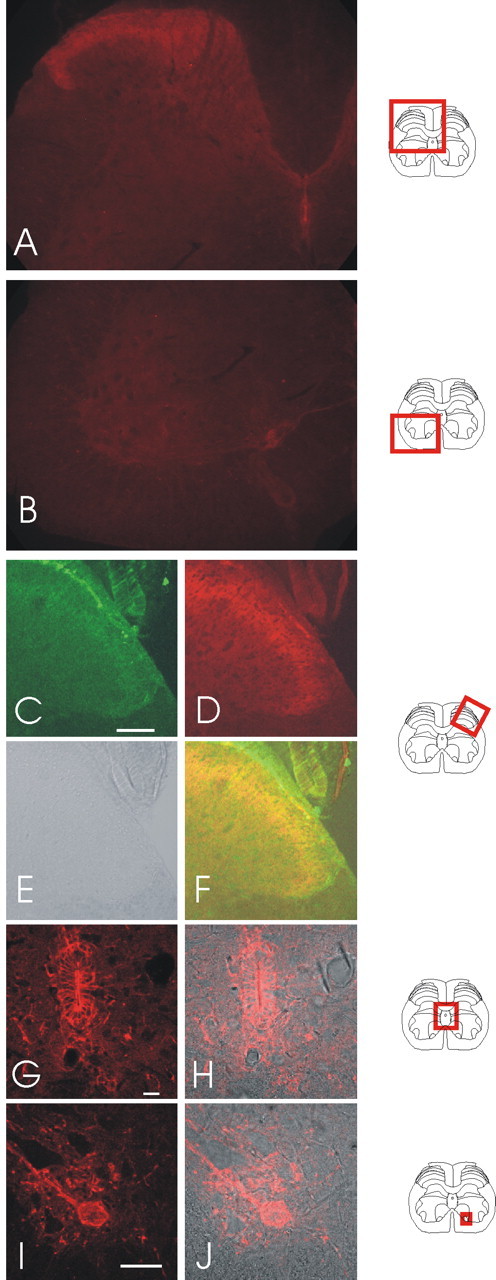
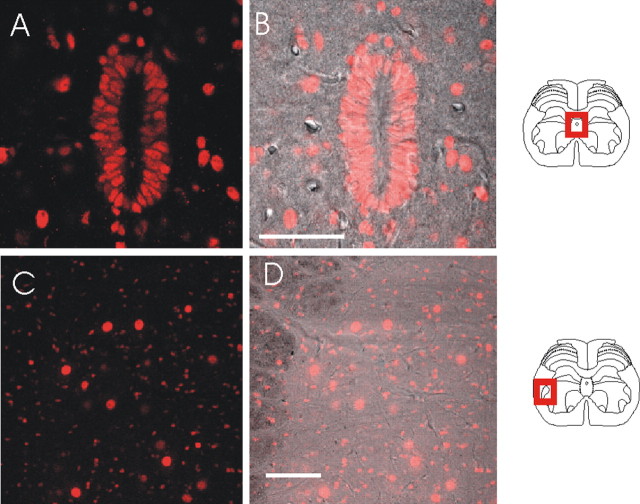
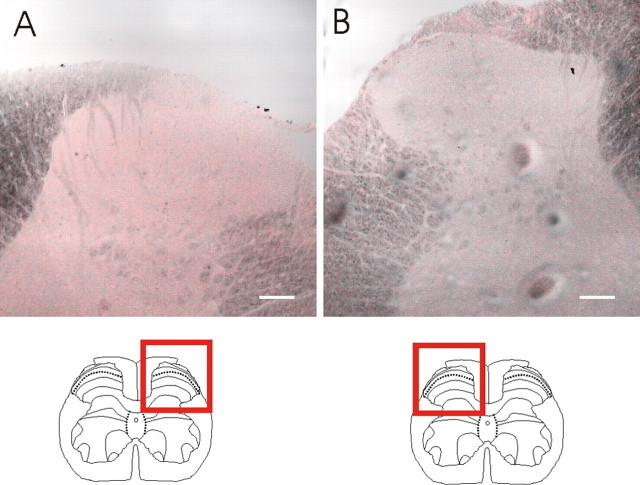
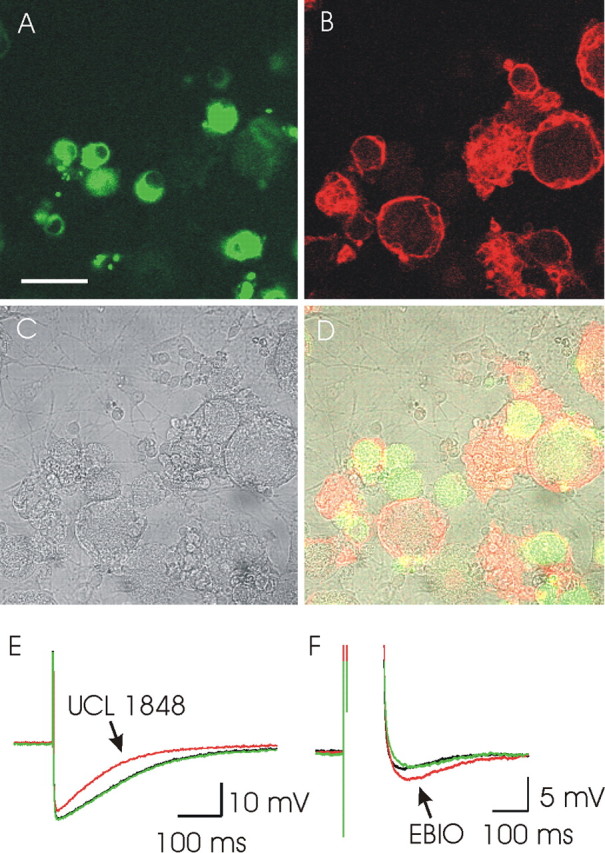
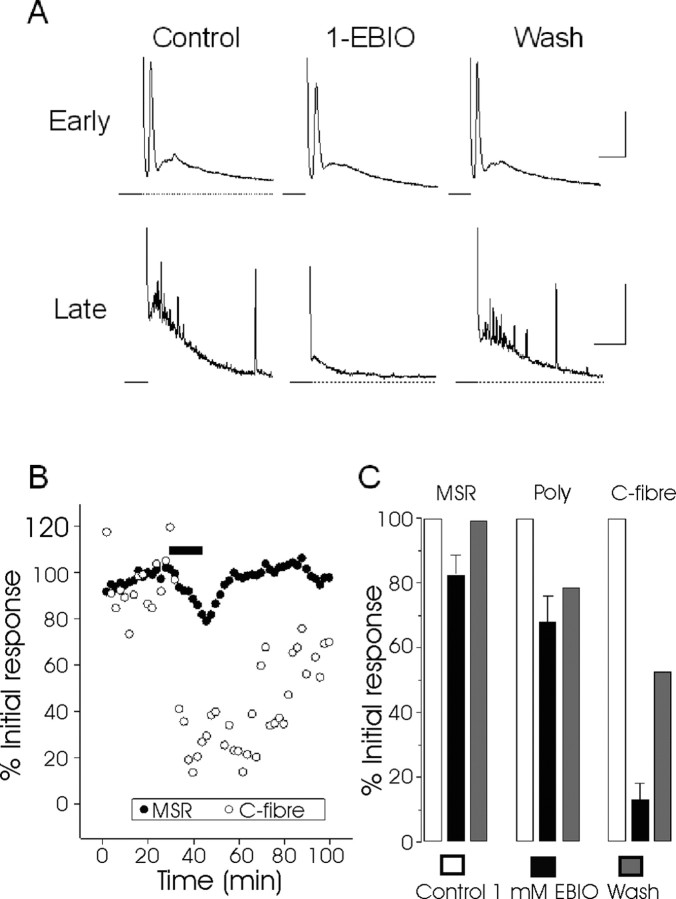
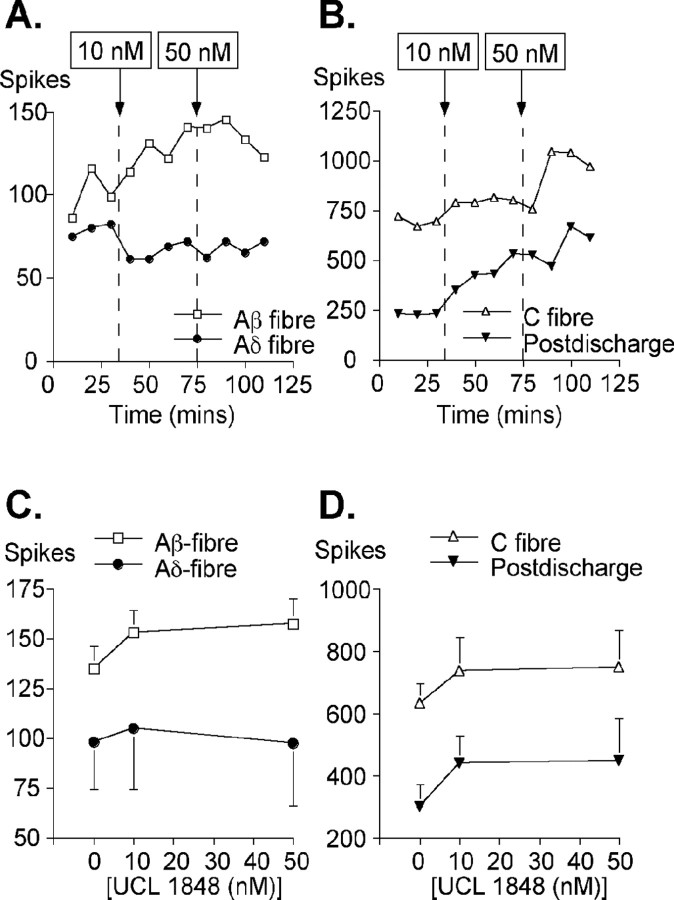
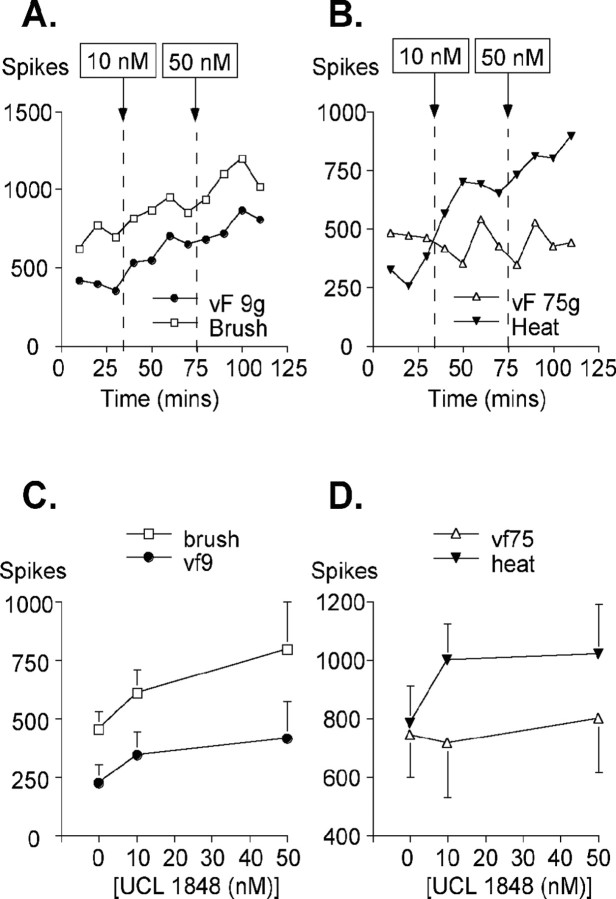
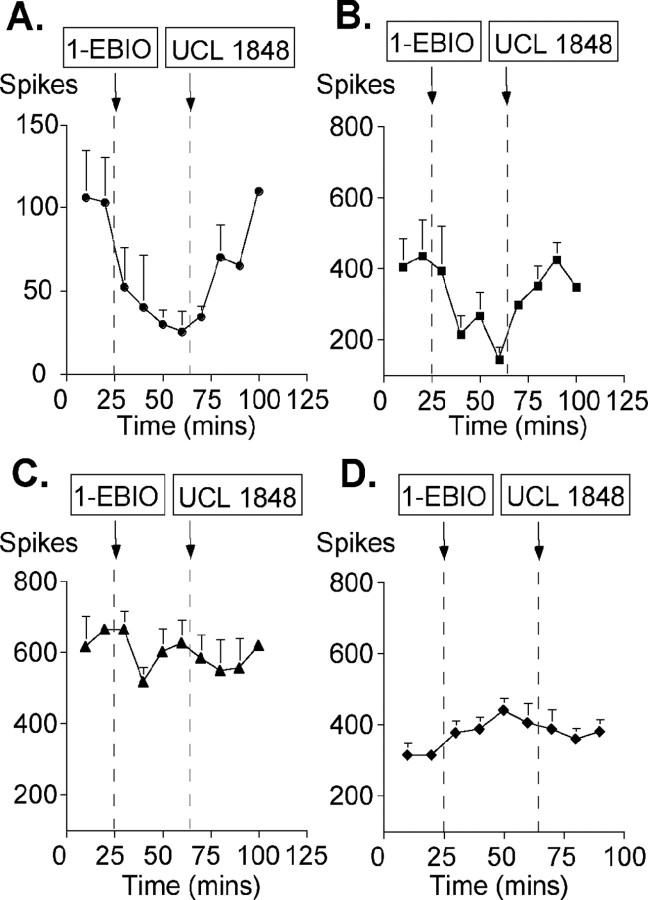
We investigated the role of small-conductance calcium-activated potassium (SK) and intermediate-conductance calcium-activated potassium channels in modulating sensory transmission from peripheral afferents into the rat spinal cord. Subunit-specific antibodies reveal high levels of SK3 immunoreactivity in laminas I, II, and III of the spinal cord. Among dorsal root ganglion neurons, both peripherin-positive (C-type) and peripherin-negative (A-type) cells show intense SK3 immunoreactivity. Furthermore, dorsal root-stimulated sensory responses recorded in vitro are inhibited when SK channel activity is increased with 1-ethyl-2-benzimidazolinone (1-EBIO). In vivo electrophysiological recordings show that neuronal responses to naturally evoked nociceptive and nonnociceptive stimuli increase after application of the selective SK channel blocker 8,14-diaza-1,7(1,4)-diquinolinacyclotetradecaphanedium di-trifluoroacetate (UCL 1848), indicating that SK channels are normally active in moderating afferent input. Conversely, neuronal responses evoked by mechanical stimuli are inhibited when SK channel activity is increased with 1-EBIO. These effects are reversed by the subsequent application of UCL 1848. Our data demonstrate that SK channels have an important role in controlling sensory input into the spinal cord.


Figures

Figure 1.
Figure 1.
Specificity of the rat SK and IK channel subunits tested on HEK 293 cells transfected with rat SK and IK channel constructs. A-D, Positive controls are shown. Each group of four images shows GFP fluorescence in the top left panel (indicating positive transfection), the bright-field image (top right), the antibody stain (bottom left), and an overlay of all three images (bottom right). A, Staining with the IK1 antibody. B, Staining with the SK1 antibody. C, Staining with the SK3 antibody. D, Staining with the SK2 antibody. E, Negative controls. Each panel shows GFP staining (top left) antibody staining (top right), bright-field image (bottom left), and an overlay of all channels (bottom right). For each panel, the transfected subunit is listed at the far left of the row, whereas the antibody used for staining is listed above the panel. Scale bars, 20 μm.
Figure 2.
Figure 2.
SK3 staining in spinal cord slices with positions indicated by diagrams on the right side. A, B, Standard fluorescent low-magnification views of SK3 staining in the dorsal and ventral horns of the spinal cord. C, Higher-resolution confocal images of the dorsal horn of rat lumbar spinal sections with stained with the VR1 antibody. D, SK3 staining of the same section. E, A bright-field image of the section shown in C and D. F, An overlay of VR1, SK3, and bright-field images. G, SK3 staining of the ependymal cells of the spinal cord. H, SK3 staining from G overlaid with the bright-field image. I, An example of SK3 staining in the motoneuron region of the ventral horn. SK3 protein appears in both cell bodies and processes. J, The SK3 staining in I overlaid with the bright-field image. Scale bars: C, 100 μm; G, 20 μm; I, 50 μm.
Figure 3.
Figure 3.
Staining for IK1 in rat spinal cord lumbar sections. A, Staining of the ependymal cells surrounding the central canal and cell bodies scattered throughout the spinal cord. B, Ependymal cell staining overlaid with the bright-field image. C, Additional examples of the IK1-positive cells, this time in the ventral horn. D, Staining of C overlaid with a bright-field image. Scale bars: (in B, D) 50 μm. Diagrams on the right indicate the position of the field shown.
Figure 4.
Figure 4.
Dorsal horn region of the spinal cord, stained with SK1 and SK2 antibodies. A specific stain was not seen for SK1 (A) or SK2 (B) at concentrations that produced a signal in transfected HEK 293 cells (Fig. 1). Scale bars, 100 μm.
Figure 5.
Figure 5.
SK3 immunofluorescent antibody staining and AHP pharmacology of rat DRG cells in culture. A, Peripherin staining of DRG cells in culture (green). Intense staining for this marker is limited to small-diameter cells (≤25 μm). B, SK3 staining (red). Both large- and small-diameter DRG neurons stain positively. C, A bright-field image of the same field of cells. D, An overlay of images A-C. SK3 can be seen in both peripherin-positive and peripherin-negative cells. Scale bar, 50 μm. E, An AHP recorded from a DRG neuron showing a component that is sensitive to block by UCL 1848 (10 nm). The recording was made using the perforated patch configuration. F, An AHP recorded from a cultured rat DRG neuron showing activation in response to 300 μm 1-EBIO (EBIO). This recording was made using an intracellular electrode to inject a depolarizing current pulse and hence to stimulate the cell AHP. Both E and F are the averages of three successive responses to a single action potential (E) or a depolarizing pulse (F). For both E and F, the AHP before drug application is shown in black, the AHP after drug application is shown in red, and the AHP after drug washout is shown in green.
Figure 6.
Figure 6.
Modulation of synaptic transmission in the neonatal rat spinal cord in vitro by 1-EBIO. The traces show ventral root potentials evoked by dorsal root stimulation. A, Representative recordings of DR-VRPs in the absence (control) and presence of 1-EBIO (1 mm) and after washout. Note the small, reversible reduction of the early components of the VRP (monosynaptic and polysynaptic reflex) by 1-EBIO and the much more marked attenuation of the late component (C-fiber; slow). Calibration for the early phase is 10 ms and 0.5 mV, whereas for the late phase it is 2 s and 0.2 mV. B, A typical time course of 1-EBIO (EBIO) action. The drug was present for the time indicated by the solid bar. The peak MSR amplitude (solid circles) and the C-fiber slow VRP area (open circles) were normalized to the control values obtained immediately before EBIO addition. Data for the polysynaptic reflex are omitted for clarity. C, Mean data from three experiments (vertical bars show SEM) for the MSR, polysynaptic response (Poly) (area 15-100 ms), and the slow C-fiber-mediated VRP.
Figure 7.
Figure 7.
The effect of SK channel block on electrically stimulated afferent fiber input measured in lamina V wide dynamic range dorsal horn neurons. A, Examples of the Aβ-fiber (open squares) and Aδ-fiber (filled circles) input recorded from single neurons, before and after the application of UCL 1848. B, Examples of electrically stimulated input from C-fibers (open triangles) and in the postdischarge (filled triangles) before and after the application of UCL 1848. For both A and B, the dashed line indicates the point of drug addition (at either 10 or 50 nm concentrations). C, The averaged responses seen in Aβ- and Aδ-fiber input (n = 6). D, The averaged responses seen in C-fibers and in the postdischarge (n = 6). For both C and D, the mean ± SE is shown for each dose.
Figure 8.
Figure 8.
The effect of SK channel block on naturally stimulated afferent fiber input measured in lamina V wide dynamic range neurons. A, Examples of the responses to brush (open squares) and von Frey (vF) 9 g (filled circles) stimuli recorded from single neurons before and after the application of UCL 1848. B, Examples of responses to nociceptive heat (filled triangles) and von Frey (vF) 75 g (open triangles) stimuli recorded single neurons before and after the application of UCL 1848. For both A and B, the dashed line indicates the point of drug addition (at either 10 or 50 nm concentrations). C, The averaged responses seen after stimulation by brush or by von Frey (vf) 9 g fiber (n = 5 and 6, respectively). D, The averaged responses seen after stimulation by heat or by von Frey (vf) 75 g (n = 6). For both C and D, the mean ± SE is shown for each dose.
Figure 9.
Figure 9.
The effect of 1-EBIO, an enhancer of SK activity, on afferent fiber input in response to sensory stimuli. Stimulation using a von Frey 9 g fiber (A), a von Frey 75 g fiber (B), noxious heat (C), and brush (D) is shown. Each data point represents the response (±SE) averaged from three recordings. Dashed lines indicate the point at which drugs were added (either 300 μm 1-EBIO or 10 nm UCL 1848).

References

    1. Abdulla FA, Smith PA (2001) Axotomy- and autotomy-induced changes in Ca2+ and K+ channel currents of rat dorsal root ganglion neurons. J Neurophysiol 85: 644-658. - PubMed
    1. Amir R, Devor M (1997) Spike-evoked suppression and burst patterning in dorsal root ganglion neurons of the rat. J Physiol (Lond) 501: 183-196. - PMC - PubMed
    1. Banks BE, Brown C, Burgess GM, Burnstock G, Claret M, Cocks TM, Jenkinson DH (1979) Apamin blocks certain neurotransmitter-induced increases in potassium permeability. Nature 282: 415-417. - PubMed
    1. Benton DCH, Monaghan AS, Hosseini R, Bahia PK, Haylett DG, Moss GWJ (2003) Small conductance Ca2+-activated K+ channels formed by the expression of rat SK1 and SK2 genes in HEK 293 cells. J Physiol (Lond) 553: 13-19. - PMC - PubMed
    1. Blank T, Nijholt I, Kye MJ, Radulovic J, Spiess J (2003) Small-conductance, Ca2+-activated K+ channel SK3 generates age-related memory and LTP deficits. Nat Neurosci 6: 911-912. - PubMed

Publication types

MeSH terms