Comparative Study
. 2005 Apr 6;25(14):3578-85.
doi: 10.1523/JNEUROSCI.4177-04.2005.

Proopiomelanocortin neurons in nucleus tractus solitarius are activated by visceral afferents: regulation by cholecystokinin and opioids

Affiliations
Comparative Study

Proopiomelanocortin neurons in nucleus tractus solitarius are activated by visceral afferents: regulation by cholecystokinin and opioids

Suzanne M Appleyard et al. J Neurosci. .

Abstract

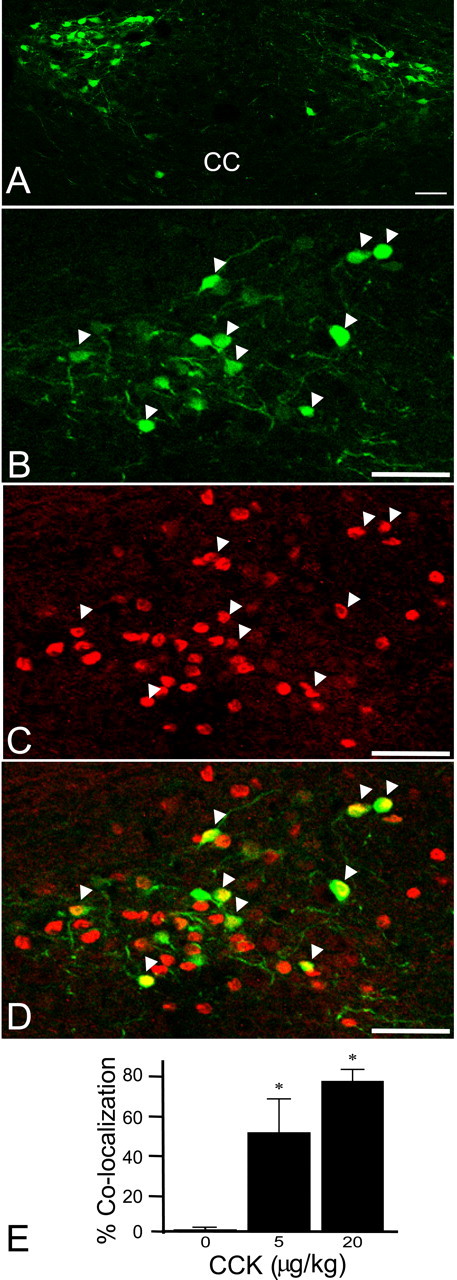
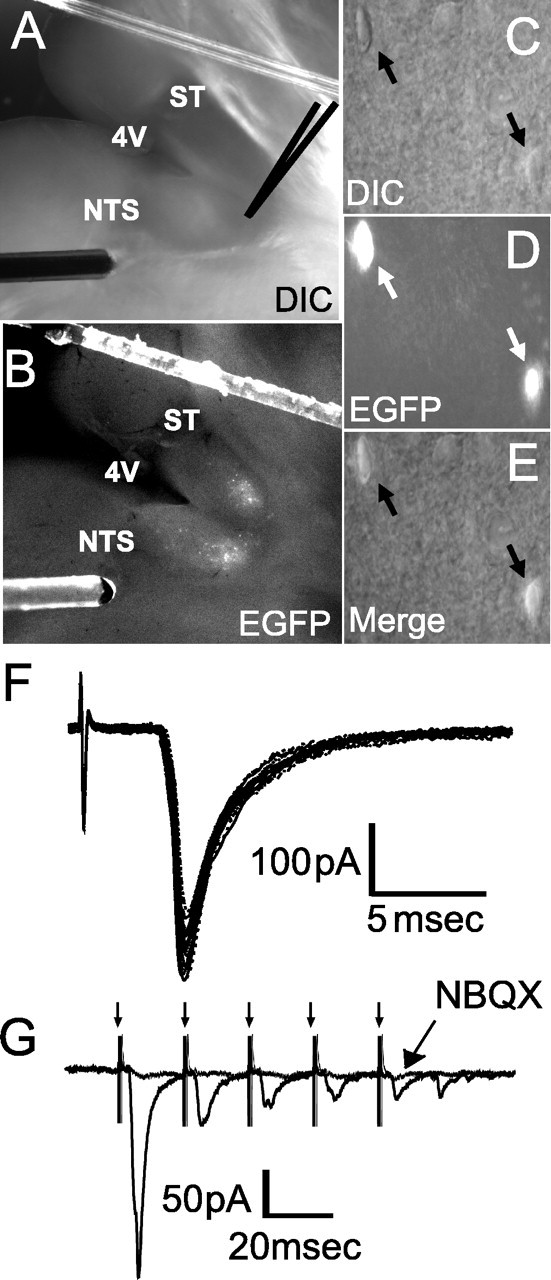
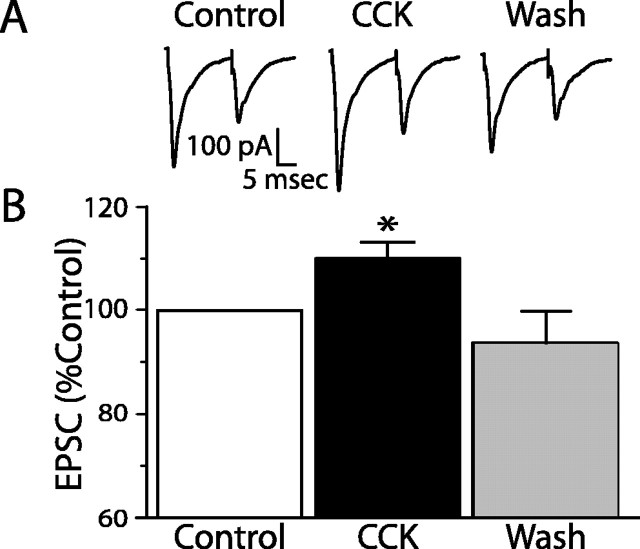
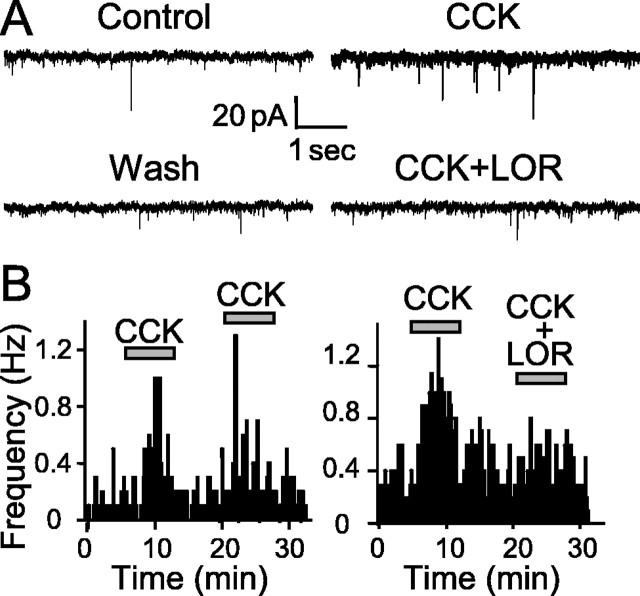
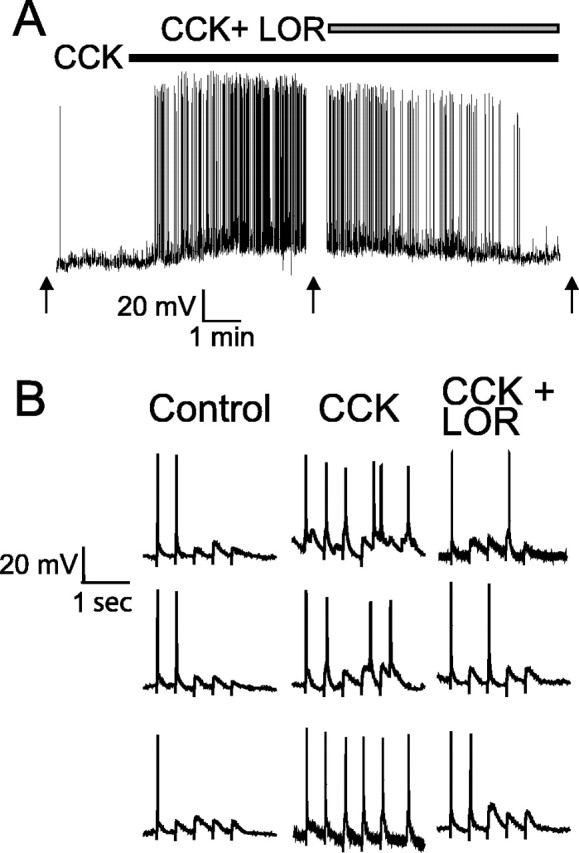
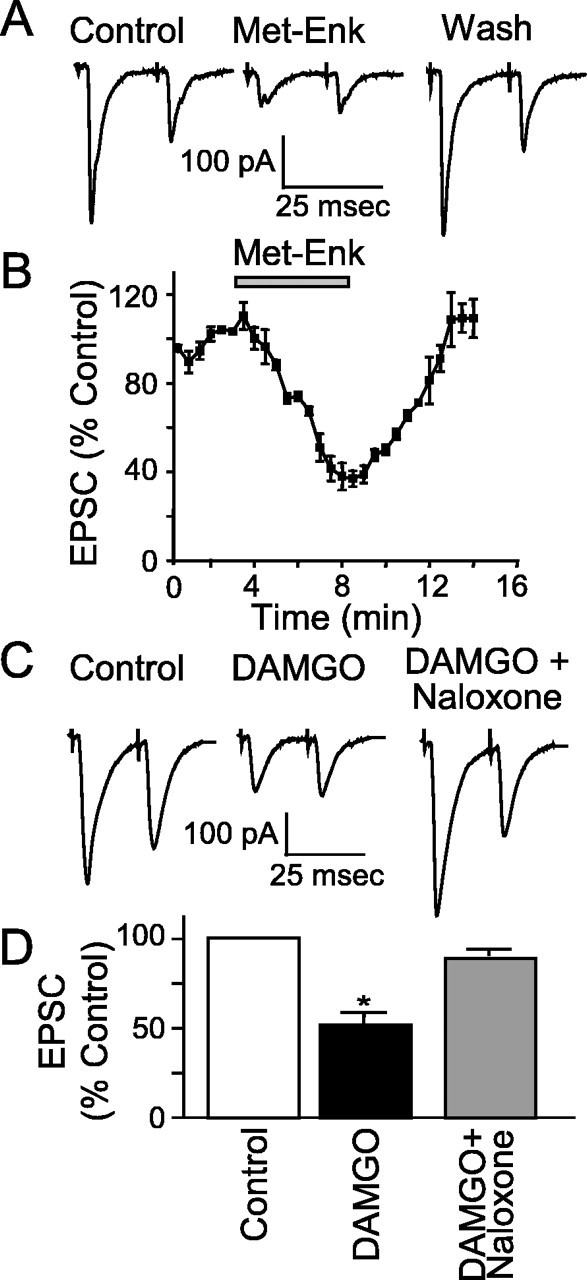
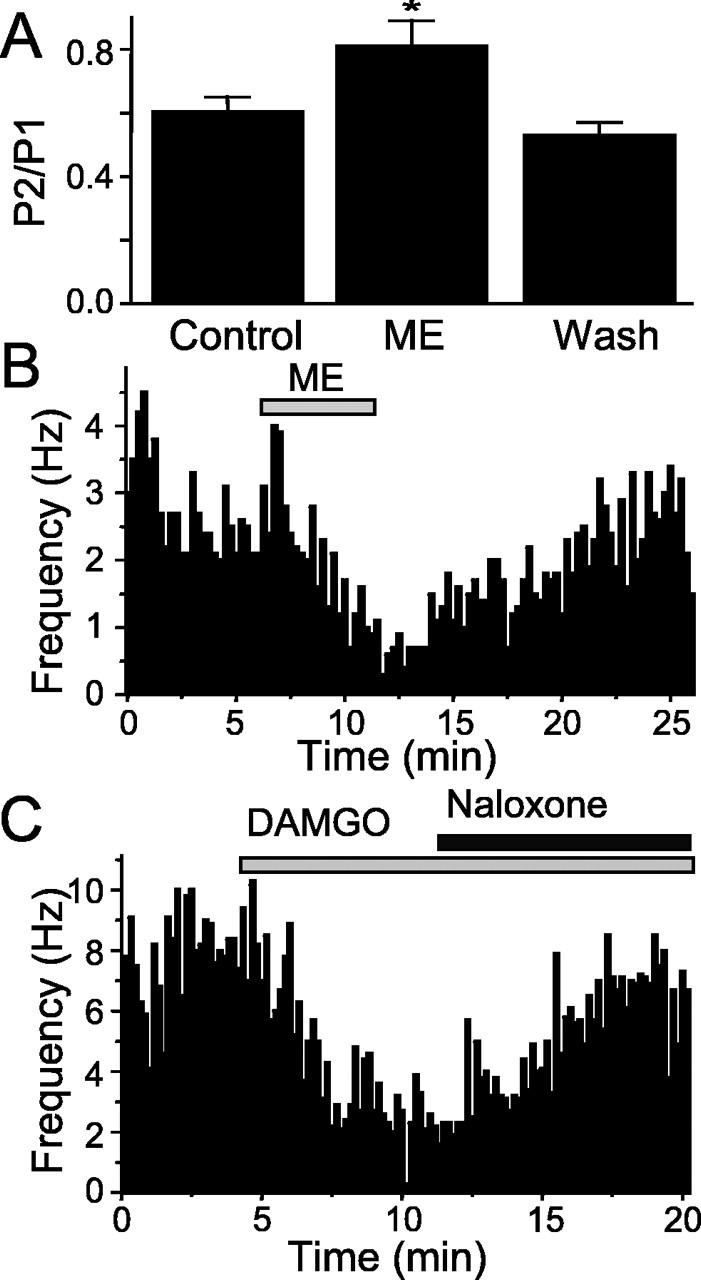
The nucleus tractus solitarius (NTS) receives dense terminations from cranial visceral afferents, including those from the gastrointestinal (GI) system. Although the NTS integrates peripheral satiety signals and relays this signal to central feeding centers, little is known about which NTS neurons are involved or what mechanisms are responsible. Proopiomelanocortin (POMC) neurons are good candidates for GI integration, because disruption of the POMC gene leads to severe obesity and hyperphagia. Here, we used POMC-enhanced green fluorescent protein (EGFP) transgenic mice to identify NTS POMC neurons. Intraperitoneal administration of cholecystokinin (CCK) induced c-fos gene expression in NTS POMC-EGFP neurons, suggesting that they are activated by afferents stimulated by the satiety hormone. We tested the synaptic relationship of these neurons to visceral afferents and their modulation by CCK and opioids using patch recordings in horizontal brain slices. Electrical activation of the solitary tract (ST) evoked EPSCs in NTS POMC-EGFP neurons. The invariant latencies, low failure rates, and substantial paired-pulse depression of the ST-evoked EPSCs indicate that NTS POMC-EGFP neurons are second-order neurons directly contacted by afferent terminals. The EPSCs were blocked by the glutamate antagonist 2,3-dihydroxy-6-nitro-7-sulfonyl-benzo[f]quinoxaline. CCK increased the amplitude of the ST-stimulated EPSCs and the frequency of miniature EPSCs, effects attenuated by the CCK1 receptor antagonist lorglumide. In contrast, the orexigenic opioid agonists [D-Ala(2), N-Me-Phe(4), Gly-ol(5)]-enkephalin and met-enkephalin inhibited both ST-stimulated EPSCs and the frequency of miniature EPSCs. These findings identify a potential satiety pathway in which visceral afferents directly activate NTS POMC-EGFP neurons with excitatory inputs that are appropriately modulated by appetite regulators.


Figures

Figure 1.
Figure 1.
CCK induces c-fos expression in NTS POMC-EGFP neurons. A, Distribution of NTS POMC-EGFP neurons in a coronal section of the mouse brainstem. EGFP-positive neurons appear green. CC, Central canal. B-D, c-fos induction by 20 μg/kg CCK. CCK strongly increased c-fos gene expression. B, EGFP. C, c-fos. D, Merged image. EGFP-positive neurons appear green, c-fos expression appears red, and colocalization appears yellow. Arrowheads indicate examples of colocalization. E, Bar graph showing the average number of c-fos-positive POMC-EGFP neurons after different doses of CCK (*p < 0.05; Student's t test; compared with saline control). Saline, 2 of 231 neurons (9 slices from 4 animals); 5 μg/kg CCK, 64 of 115 neurons (6 slices from 3 animals); and 20 μg/kg CCK, 129 of 175 (8 slices from 3 animals). Scale bars: A, 50 μm; B-D, 25 μm. Error bars represent SEM.
Figure 2.
Figure 2.
Solitary tract-evoked NTS synaptic responses in NTS POMC-EGFP neurons. A, B, Visualization of the NTS brain-slice preparation using both DIC (A) and fluorescence (B). Orientation of the mouse brainstem slices in the horizontal plane allowed the placement of the concentric bipolar stimulating electrode on the ST several millimeters from the recording region (dark gray center) in the medial NTS. 4V, Fourth ventricle. C, E, Identification of individual POMC-EGFP neurons by DIC (C), fluorescence (D), and merge (E). Two POMC-EGFP-positive neurons can be seen (arrows). F, ST activation evoked monosynaptic EPSCs in an NTS POMC-EGFP neuron; a total of 10 successive EPSCs are shown. Vm = -60 mV. ST shock evoked a short-latency EPSC with high reliability (latency, 1.58 ms; jitter, 65 μs and no observed failures at 50 Hz ST stimulation). G, Successive shocks (train of 5 pulses at 50 Hz; arrows) evoked a frequency-dependent depression of EPSC amplitude. The non-NMDA glutamate receptor antagonist NBQX (10 μm) completely blocked the EPSCs.
Figure 3.
Figure 3.
CCK facilitates ST-afferent transmission onto NTS POMC-EGFP neurons. A, Representative current traces for control, CCK (100 nm), and after washing (Wash). CCK significantly increased the EPSC amplitude in four of eight neurons tested (p < 0.05; Student's t test). B, Graph showing the average maximal increase in the ST-stimulated EPSC by CCK [*p < 0.05 (Student's t test) compared with control and Wash]. Error bars represent SEM.
Figure 4.
Figure 4.
CCK increases the frequency of miniature EPSCs in NTS POMC-EGFP neurons. TTX and bicuculline were included in the external solution for all experiments. A, Expanded representative current traces of spontaneous mEPSCs in control, with CCK, after washing (Wash), and with CCK plus lorglumide (LOR). B, Graph showing the frequency of mEPSCs over time. Each bar represents the number of events in a 10 s time period. CCK (10 nm) increased the rate of EPSCs, and this effect was reversed by washing for 10 min. A second application of CCK stimulated the same size increase in mEPSC frequency. In contrast, no increase in mEPSC frequency was seen when the CCK1 receptor antagonist lorglumide (1 μm) was coapplied with CCK.
Figure 5.
Figure 5.
CCK depolarizes NTS POMC-EGFP neurons and increases ST-stimulated action potentials. A, B, Voltage traces from an NTS POMC-EGFP neuron. A, CCK (100 nm) depolarized POMC neurons by 4.4 ± 0.6 mV and increased their firing rate within 2-5 min (n = 7). Arrows indicate where ST was stimulated. B, CCK (100 nm) increases the number of evoked action potentials after a train of ST stimulation (5 at 5 Hz). The effects of CCK were abolished after either being washed for 10 min (data not shown) or coapplication of the CCK1 receptor antagonist lorglumide (LOR) (10 μm). Three representative traces of each condition are shown.
Figure 6.
Figure 6.
Opioids inhibit ST-stimulated EPSCs. A, Representative current trace for control, met-enkephalin (Met-Enk; 10 μm), and after washing (Wash). Met-Enk inhibited the EPSC amplitude by 55 ± 6.3% (p < 0.05 compared with control and Wash). B, Graph showing the time course of Met-Enk inhibition of ST-stimulated EPSCs over time. C, Representative current traces showing that DAMGO (1 μm) inhibited the control EPSC and that the opioid antagonist naloxone (1 μm) reversed this effect. D, Graph showing the average maximal inhibition of the ST-stimulated EPSC by DAMGO [*p < 0.05 (RMA) compared with control and DAMGO plus naloxone].
Figure 7.
Figure 7.
Opioids increase the paired-pulse ratio of evoked EPSCs and decrease the frequency of miniature EPSCs in NTS POMC-EGFP neurons. A, Graph showing the paired-pulse ratio of the ST-stimulated EPSC (50 Hz) in control, with 10 μm ME, and after washing (Wash) [*p < 0.05 (Student's t test) compared with control and Wash]. B, Graph showing the frequency of mEPSCs over time. ME (10 μm) decreased the rate of mEPSCs, and this effect was reversed by washing for 10 min. C, Graph showing the frequency of mEPSCs over time. The μ-opioid agonist DAMGO (1 μm) decreased the rate of mEPSCs, and this effect was reversed by coapplication of the opioid antagonist naloxone. NBQX blocked all of the mEPSCs (data not shown).

References

    1. Aicher SA, Goldberg A, Sharma S, Pickel VM (2000) mu-opioid receptors are present in vagal afferents and their dendritic targets in the medial nucleus tractus solitarius. J Comp Neurol 422: 181-190. - PubMed
    1. Blevins JE, Stanley BG, Reidelberger RD (2000) Brain regions where cholecystokinin suppresses feeding in rats. Brain Res 860: 1-10. - PubMed
    1. Bodnar RJ, Hadjimarkou MM (2002) Endogenous opiates and behavior:2001. Peptides 23: 2307-2365. - PubMed
    1. Broberger C, Hokfelt T (2001) Hypothalamic and vagal neuropeptide circuitries regulating food intake. Physiol Behav 74: 669-682. - PubMed
    1. Broberger C, Holmberg K, Shi TJ, Dockray G, Hokfelt T (2001) Expression and regulation of cholecystokinin and cholecystokinin receptors in rat nodose and dorsal root ganglia. Brain Res 903: 128-140. - PubMed

Publication types

MeSH terms

LinkOut - more resources