Comparative Study
. 2005 Apr 6;25(14):3661-73.
doi: 10.1523/JNEUROSCI.5106-04.2005.

Stimulus dependence of neuronal correlation in primary visual cortex of the macaque

Affiliations
Comparative Study

Stimulus dependence of neuronal correlation in primary visual cortex of the macaque

Adam Kohn et al. J Neurosci. .

Abstract

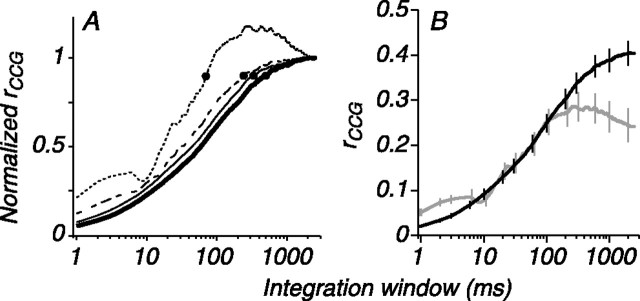
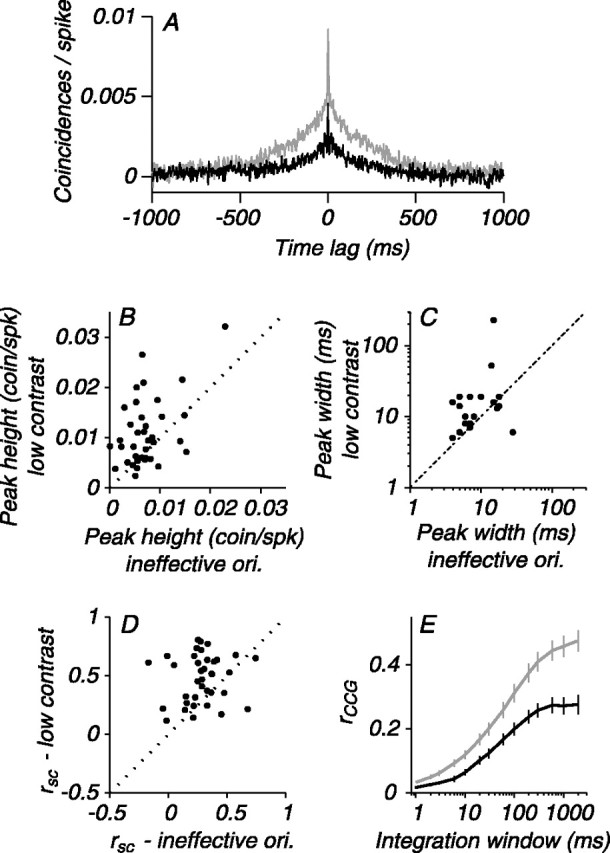
Nearby cortical neurons often have correlated trial-to-trial response variability, and a significant fraction of their spikes occur synchronously. These two forms of correlation are both believed to arise from common synaptic input, but the origin of this input is unclear. We investigated the source of correlated responsivity by recording from pairs of single neurons in primary visual cortex of anesthetized macaque monkeys and comparing correlated variability and synchrony for spontaneous activity and activity evoked by stimuli of different orientations and contrasts. These two stimulus manipulations would be expected to have different effects on the cortical pool providing input to the recorded pair: changing stimulus orientation should recruit different populations of cells, whereas changing stimulus contrast affects primarily the relative strength of sensory drive and ongoing cortical activity. Consistent with this predicted difference, we found that correlation was affected by these stimulus manipulations in different ways. Synchrony was significantly stronger for orientations that drove both neurons well than for those that did not, but correlation on longer time scales was orientation independent. Reducing stimulus contrast resulted in a decrease in the temporal precision of synchronous firing and an enhancement of correlated response variability on longer time scales. Our results thus suggest that correlated responsivity arises from mechanisms operating at two distinct timescales: one that is orientation tuned and that determines the strength of temporally precise synchrony, and a second that is contrast sensitive, of low temporal frequency, and present in ongoing cortical activity.


Figures

Figure 1.
Figure 1.
Example of the independence of spike count correlation and orientation. A, Tuning curves for two V1 neurons. Range of orientations used to measure correlation are indicated by thick lines; letters indicate the stimulus used for each scatter plot. B-F, Scatter plots of responses of V1 pair to 100 presentations of each stimulus. The response of each cell is normalized by subtracting the mean response to that stimulus and dividing by the SD of the responses. The rsc values are indicated. deg, Degrees.
Figure 2.
Figure 2.
Relationship between firing rate and rsc for stimuli of different orientations. A-E, Population histograms of rsc, arranged for each cell from the stimulus that drove the pair most effectively to that which evoked the weakest response (average firing rate for each condition indicated at right). The number next to each plot is the mean of the distribution (shown by arrowhead). The distributions are not significantly different.
Figure 3.
Figure 3.
Effect of stimulus orientation on CCGs. A, CCGs for a pair of V1 neurons for each of the five orientations tested, arranged from the stimulus that evoked the highest firing rate (top) to that which evoked the weakest response (bottom). The inset in the top row shows the central 50 ms segment of the CCG at higher resolution; vertical tick mark indicates 0 ms time lag. For stimuli that evoke weaker firing, the CCG peak height decreases; no CCG peak is evident for the least-effective orientation. Tick marks to the left of the CCGs indicate 0 coincidences per spike (coinc./spk.). B, Same as A for a second pair of V1 neurons. C, Population average CCGs calculated after normalizing CCGs for each pair by the amplitude of the CCG for the most effective orientation. CCG peak amplitude is smaller for orientations that evoke weaker firing rates.
Figure 4.
Figure 4.
CCG peak height and width for the most effective and least effective orientations. A, Pair-by-pair comparison of CCG peak height for stimuli evoking the highest firing rate with those evoking the lowest rate. Most of the points are below the identity line indicating a decrease in CCG amplitude for stimuli that evoke a weak response. B, Pair-by-pair comparison of CCG peak width, defined as the width at half-maximal amplitude. Peak width is essentially insensitive to changes in stimulus orientation. coin./spk, Coincidences per spike.
Figure 5.
Figure 5.
Effect of stimulus orientation on the time scale of correlation. A, Normalized rCCG plots calculated by integrating the CCG and ACGs for a range of integration windows. Each curve is the average rCCG (across 56 pairs) for a given stimulus condition; the dotted line is for the most effective orientation, and the dashed line is for the next highest firing rate, followed by lines of increasing thickness. Dots indicate the time at which rCCG for each condition reaches 90% of its final value. B, Nonnormalized average rCCG curves for the most effective (gray) and least effective (black) stimuli. The value of rCCG is different on short time scales, but the curves converge for integration windows >300 ms. Error bars indicate SEM.
Figure 6.
Figure 6.
Correlation in pairs without significant spike timing correlation. A, Average CCGs for most effective (gray) and least effective (black) stimuli in 44 pairs of V1 neurons for which we observed no significant peak in the CCG. B, The average rCCG curves for these pairs reveals no difference between the most effective (gray) and least effective (black) orientations. The rCCG for the most effective orientation in pairs with significant CCG peaks, identical to that in Figure 5B, is replotted as a thin, black line for comparison. Correlation is weaker on all time scales in pairs without CCG peaks. coin/spk, Coincidences per spike. Error bars indicate SEM.
Figure 7.
Figure 7.
Relationship between firing rate and rsc for stimuli of different contrasts. A-D, Population histograms of rsc, arranged for each cell from the stimulus that drove the pair most effectively to that which evoked the weakest response, which was almost always the highest to lowest contrast. The number next to each plot is the mean of the distribution (shown by arrowhead). The average rsc increases significantly as stimulus contrast is lowered.
Figure 8.
Figure 8.
Effect of stimulus contrast on CCGs. A, CCGs for each of four contrasts, arranged from the stimulus that evoked the highest firing rate (top) to that which evoked the weakest response (bottom). As the contrast of the stimulus is reduced, the CCG peak decreases in amplitude and broadens substantially. Tick marks to the left of the CCGs indicate 0 coincidences per spike (coinc./spk.). This is the same pair shown in Figure 4 A. B, Same as A for a second pair of V1 neurons. C, Population average CCGs. CCG peak amplitude is smaller for contrasts that evoke weaker firing rates, but the width of the CCG increases substantially.
Figure 9.
Figure 9.
Effect of stimulus contrast on the time scale of correlation. A, Normalized rCCG plots (across 57 V1 pairs) for each stimulus contrast; the dotted line is for the highest contrast, followed by the dashed line and solid lines of increasing thickness. The curve for the highest contrast has the most area on a short time scale and reaches it maximal value most quickly. Less effective stimuli have more area at long time scales and reach their final value more slowly. Dots indicate the 90% rise time of rCCG. B, Nonnormalized rCCG curves for high- (gray) and low-contrast (black) stimuli. The value of rCCG is larger for high-contrast stimuli because these stimuli evoke a large, narrow CCG peak, but the additional CCG area at long time scales for low-contrast stimuli results in larger rCCG values for these stimuli on long time scales. Error bars indicate SEM.
Figure 10.
Figure 10.
Direct comparison of correlation for low-contrast and ineffectively oriented stimuli that evoke similar firing rates. A, Average CCGs for low-contrast (gray) and ineffectively oriented (black) stimuli. CCGs are larger and broader at low contrast. B, Pair-by-pair comparison of CCG peak height for low-contrast and ineffective orientations (ori.). Low-contrast CCGs have larger peaks. C, Pair-by-pair comparison of CCG peak width. Low-contrast CCGs are broader. D, Comparison of the spike count correlation. The rsc values are consistently larger for low-contrast stimuli. E, Comparison of the time scale of correlation for low-contrast (gray) and ineffective orientations (black). The average rCCG for low-contrast stimuli is larger on all time scales. coin/spk, Coincidences per spike. Error bars indicate SEM.
Figure 11.
Figure 11.
Comparison of spontaneous and evoked correlation. A, CCGs for activity evoked by the most effective orientation (top), the least effective orientation (middle), and spontaneous activity (bottom; gray) for an example V1 pair. The spontaneous CCG is larger and broader than that for the best-compromise stimulus. The least effectively oriented stimulus disrupts the broad CCG observed during spontaneous activity. B, Same as in A for a pair for which the CCG of spontaneous activity and activity evoked by the least effective orientation have a similar amplitude; the spontaneous CCG is substantially broader than those for activity evoked by high-contrast stimuli. C, Average CCGs (n = 24 pairs) for spontaneous activity (gray) and activity evoked by ineffective orientations (black). Although the firing rate was stronger for the evoked activity, the CCG peak amplitude was smaller. Vertical calibration is 0.01 coincidences per spike (coinc/spk) for A, 0.02 coinc/spk for B, and 0.01 coinc/spk for C; horizontal calibration is 500 ms. D, Time scale of correlation for spontaneous (gray) and ineffective (black) stimuli. The rCCG curves show that correlation is stronger for the spontaneous activity at all time scales. Error bars indicate SEM.
Figure 12.
Figure 12.
Relationship between signal correlation and spike count correlation. There is a weak relationship (r = 0.27) between rsignal and rsc, indicating that neurons with similar receptive field properties tend to have stronger correlation in trial-to-trial variability.

References

    1. Abbott LF, Dayan P (1999) The effect of correlated variability on the accuracy of a population code. Neural Comput 11: 91-101. - PubMed
    1. Aertsen AM, Gerstein GL, Habib MK, Palm G (1989) Dynamics of neuronal firing correlation: modulation of “effective connectivity.” J Neurophysiol 61: 900-917. - PubMed
    1. Amzica F, Steriade M (1995) Short- and long-range neuronal synchronization of the slow (<1 Hz) cortical oscillation. J Neurophysiol 73: 20-38. - PubMed
    1. Anderson JS, Carandini M, Ferster D (2000) Orientation tuning of input conductance, excitation, and inhibition in cat primary visual cortex. J Neurophysiol 84: 909-926. - PubMed
    1. Anderson T (1984) An introduction to multivariate statistical analysis. New York: Wiley.

Publication types