. 2005 Jun;16(6):2772-85.
doi: 10.1091/mbc.e05-01-0079. Epub 2005 Apr 6.

Role for the SCFCDC4 ubiquitin ligase in Candida albicans morphogenesis

Affiliations

Role for the SCFCDC4 ubiquitin ligase in Candida albicans morphogenesis

Avigail Atir-Lande et al. Mol Biol Cell. 2005 Jun.

Abstract

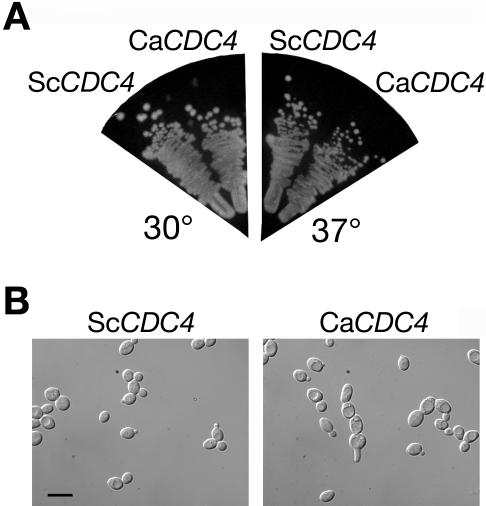
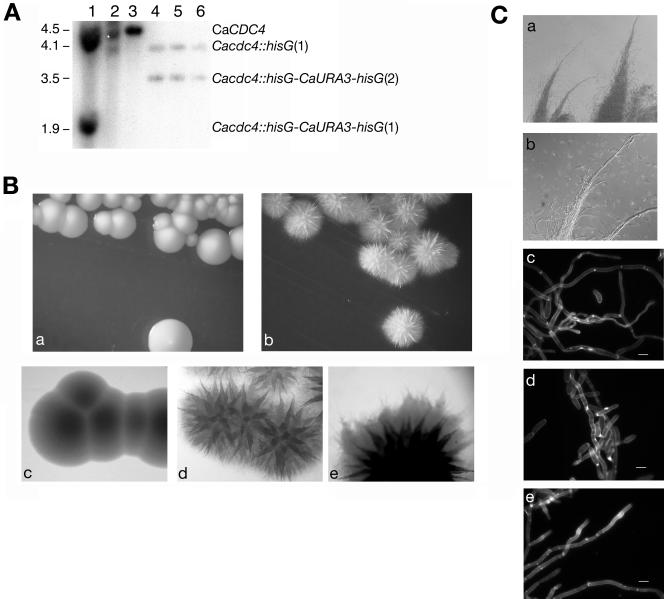
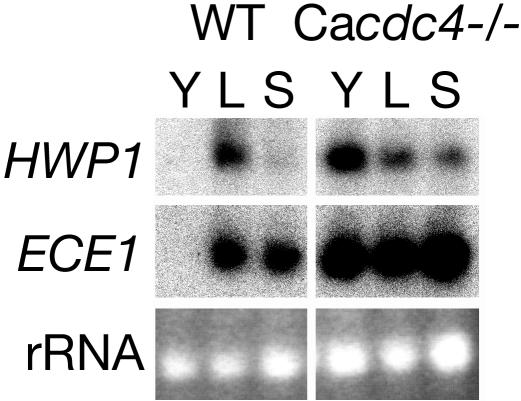
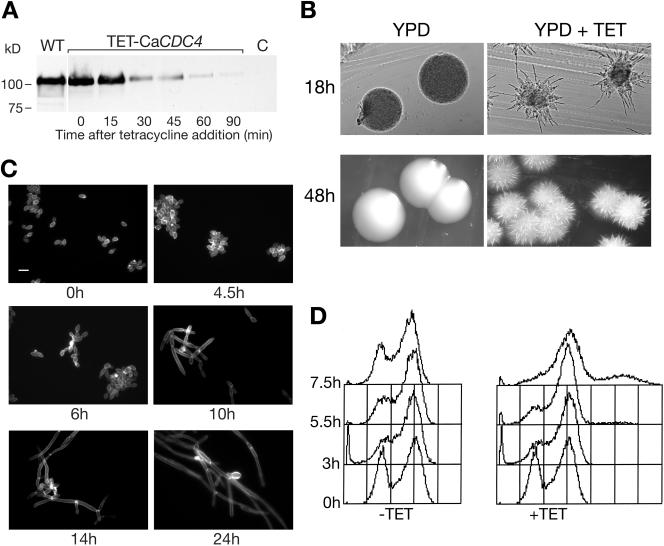
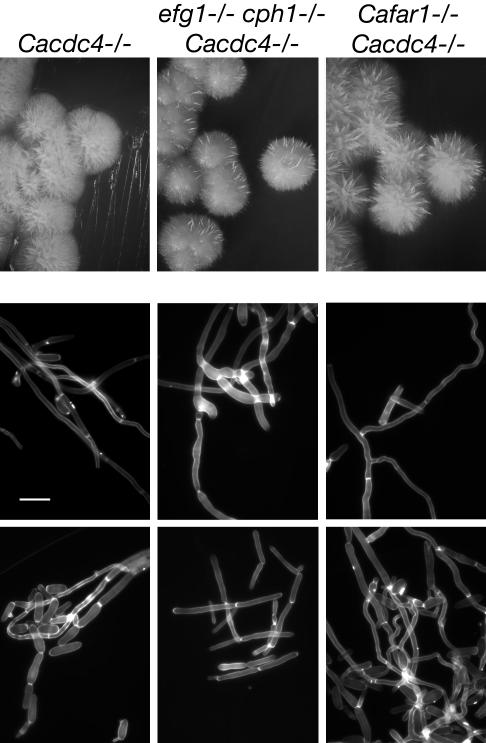
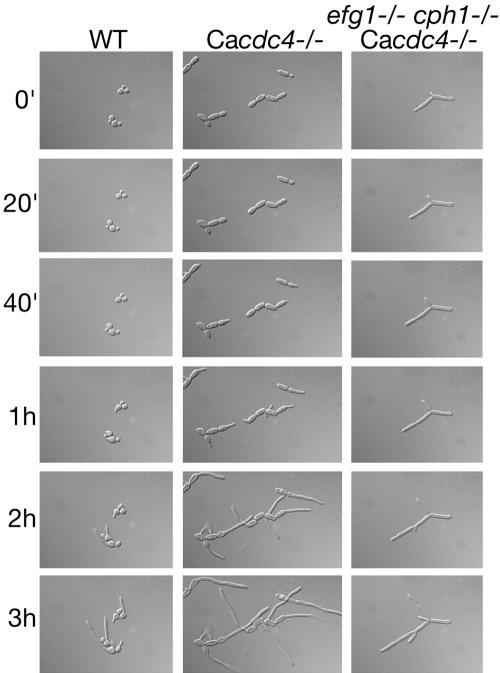
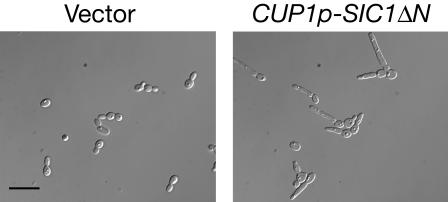
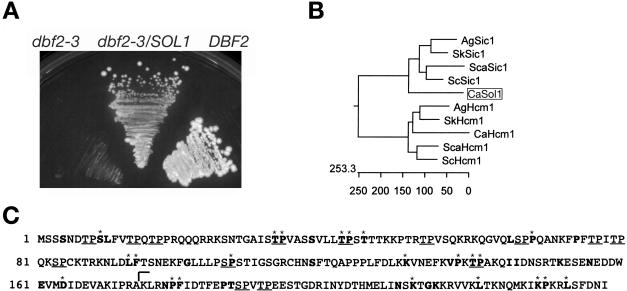
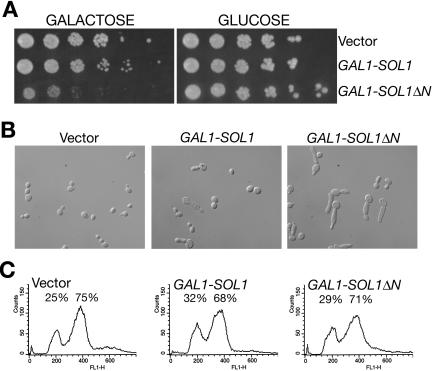
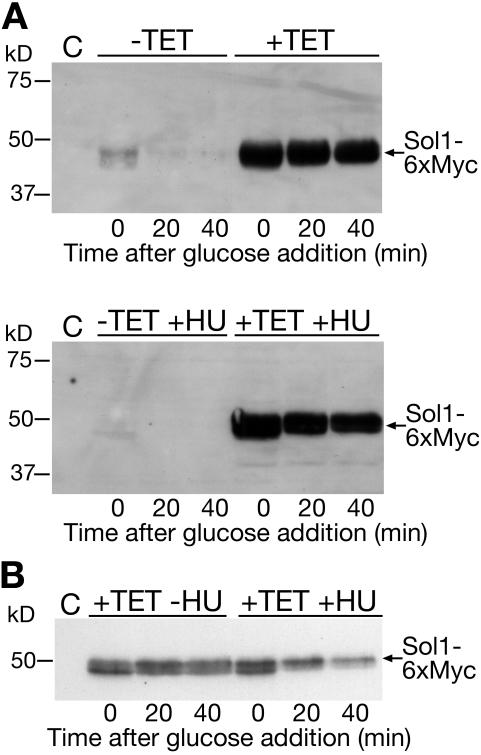
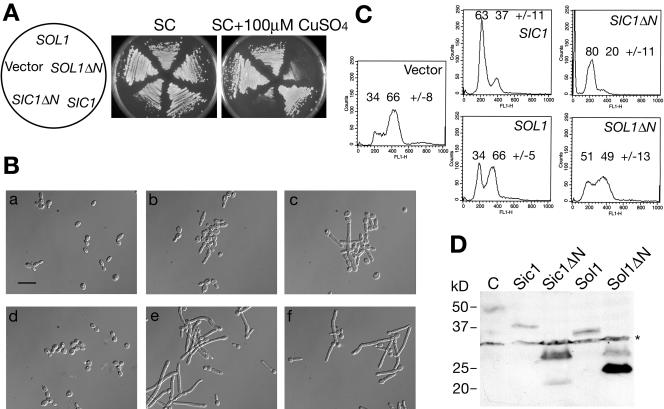
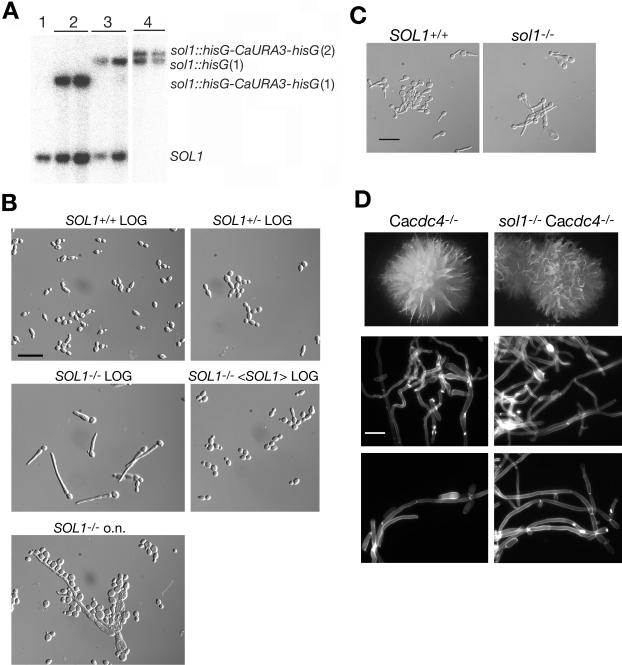
The ability of Candida albicans, a major fungal pathogen, to switch between a yeast form, and a hyphal (mold) form is recognized as being important for the ability of the organism to invade the host and cause disease. We found that a C. albicans mutant deleted for CaCDC4, a homologue of the Saccharomyces cerevisiae F-box protein component of the SCF(CDC4) ubiquitin ligase, is viable and displays constitutive filamentous, mostly hyphal, growth. The phenotype of the Cacdc4-/- mutant suggests that ubiquitin-mediated protein degradation is involved in the regulation of the dimorphic switch of C. albicans and that one or more regulators of the yeast-to-mold switch are among the substrates of SCF(CaCDC4). Epistasis analysis indicates that the Cacdc4-/- phenotype is largely independent of the filamentation-inducing transcription factors Efg1 and Cph1. We identify C. albicans Far1 and Sol1, homologues of the S. cerevisiae SCF(CDC4) substrates Far1 and Sic1, and show that Sol1 is a substrate of C. albicans Cdc4. Neither protein is essential for the hyphal phenotype of the Cacdc4-/- mutant. However, ectopic expression and deletion of SOL1 indicate a role for this gene in C. albicans morphogenesis.


Figures

Figure 1.
Figure 1.
CaCDC4 is able to suppress the lethality of a deletion of CDC4. (A) Colonies of a cdc4Δ strain carrying either S. cerevisiae or C. albicans CDC4 on plasmid KB1083 and grown for 2 d on YPD plates at 30 or 37°C, as indicated. (B) Cell morphology of the same strains grown at 30°C in YPD. Bar, 10 μm.
Figure 2.
Figure 2.
Deletion of C. albicans CDC4. (A) Southern blot analysis of the CaCDC4 region in the following strains: lane 1, KC135 (CaCDC4/Cacdc4Δ::hisG-URA3-hisG); lane 2, KC136 (CaCDC4/Cacdc4Δ::hisG); lane 3, CAI4 (CaCDC4/CaCDC4); and lanes 4–6, KC137, 138, 139 (CAI4 Cacdc4Δ::hisG/Cacdc4Δ::hisG-URA3-hisG). The genomic DNA was digested with XhoI and XbaI, and probed with the XhoI-SpeI fragment of plasmid KB1344-1, which corresponds to the 3′ region of CaCDC4. (B) Cacdc4/– colony phenotype of cells grown for 2 d at 30°C on YPD. Wild-type C. albicans (CAI4) (a); Cacdc4/– mutant (KC138) on a YPD plate; backlit exposure of wild-type and mutant colonies (c and d), to show the structure of the colony; and the halo around the mutant colony (KC138) (e) represents hyphae penetrating the agar. (C) Micrographs of the protuberances displayed by the Cacdc4/– mutant colonies, at 100× (a) and 200× (b) magnifications; calcofluor staining of cells from the Cacdc4/– colony (c), grown in liquid YPD overnight (d), or diluted in liquid YPD from an overnight culture and grown for 5 h (e). For c and d, mycelia were broken mechanically before visualization; for e, the edge of a small mycelium is shown. Bar, 10 μm.
Figure 3.
Figure 3.
Northern blot of HWP1 and ECE1 in wild-type and Cacdc4/– cells. Cultures were grown in YPD (Y) or in two types of inducing conditions: YPD + 20% serum for 2 h at 37°C (S) or Lee's medium for 4 h at 37°C (L). RNA (20 μg) was loaded in each lane and detected with PCR products corresponding to the whole open reading frame of ECE1 or to nucleotides +72 to +1120 of HWP1.
Figure 4.
Figure 4.
Effect of CaCDC4 shutoff on C. albicans morphology. (A) Western blot of CaCdc4-13 × Myc in a wild-type background strain or in strain KC200 after addition of 100 mg/ml tetracycline. C indicates a nontagged control strain. (B) Colony phenotype of strain KC200 (TET-CaCDC4) after 18 or 48 h on YPD agar with or without 100 mg/ml tetracycline. (C) Cell morphology of strain KC200 in liquid YPD at the indicated times after addition of 100 mg/ml tetracycline. The culture was diluted several times over the time course to keep it in logarithmic phase. Cells were stained with calcofluor and visualized by epifluorescence with a DAPI filter. Bar, 10 mm. (D) Cell cycle distribution upon depletion of CaCdc4. KC200 cells were treated as for C, and aliquots, removed at the indicated time points after tetracycline addition, were subjected to FACS analysis. The cultures were diluted throughout the experiment in order to keep them in logarithmic phase. The starting culture was in late log phase, and therefore in the control culture, the 0-h time point contained a somewhat larger proportion of 2n cells than the subsequent time points.
Figure 5.
Figure 5.
Epistasis of Cacdc4/– over efg1/cph1/– and Ca-far1/–. Strains KC138 (Cacdc4/–), KC180 (efg1/cph1/– Cacdc4/–) and KC183 (Cafar1/– Cacdc4/–) were grown on YPD plates or in liquid YPD medium. Top row, colony morphology. Cell morphology visualized by calcofluor staining of cells from the colonies (middle row) or from an overnight liquid culture (bottom row). Bar, 20 μm.
Figure 6.
Figure 6.
Response to serum. Cells from an overnight culture of CAI4 (WT), KC138 (Cacdc4/–), and KC180 (efg1/cph1/– Cacdc4/–) were set down on a 50% fetal calf serum (FCS), 2% agar pad on a microscope slide, and an individual field of cells was followed over several hours at room temperature. To obtain an enrichment in Cacdc4/– pseudohyphal cells, the rapidly sedimenting part of a KC138 overnight culture was discarded, and the slowly sedimenting supernatant, which consists almost exclusively of pseudohyphal cells, was concentrated by centrifugation.
Figure 7.
Figure 7.
Effect of S. cerevisiae Sic1 on C. albicans cell morphology. N-terminally truncated Sic1 was expressed in strain KC16 from the CaCUP1 promoter of plasmid KB1389, by adding 100 μM CuSO4 to the cultures. Micrographs were taken after 6 h of copper induction. Bar, 20 μm.
Figure 8.
Figure 8.
Isolation of SOL1. (A) Suppression of the temperature sensitivity of dbf2-3 by SOL1. The dbf2-3 mutant transformed with a vector plasmid or with KB1606 (SOL1), and a wild-type S288C strain, were incubated for 3 d at 37°C on a YPD plate. (B) Multiple alignment of the Sol1 with four ascomycetes Sic1 homologues, as well as the corresponding Hcm1 homologues, by using the ClustalW program with PAM250 matrix. Sc, S. cerevisiae; Sca, S. castellii; Sk, S. kluyveri; Ag, Ashbya gossypii; and Ca, C. albicans. (C) Sequence of Sol1 marked with the homologies to the four ascomycete Sic1 homologues. Identities to three of the four Sic1 sequences are marked by boldface and to four of four, by a star. Potential CDK sites are underlined. The bracket marks the position homologous to the start of the C-terminal domain of ScSic1 shown to be essential for its CDKI activity (Hodge and Mendenhall, 1999).
Figure 9.
Figure 9.
Expression of Sol1 in S. cerevisiae. (A) Growth of cells expressing SOL1 or SOL1ΔN from the GAL1 promoter of plasmids KB1599 and KB1600, respectively. Increasing dilutions of W303 cells transformed with the indicated plasmids were plated on SC + 2% galactose or SC + 2% glucose, as indicated. The plates were incubated for 2 d at 30°C. (B and C) The same strains as in A were grown overnight in raffinose and then induced for 7 h with 2% galactose and photographed (B) or subjected to FACS analysis (C). The relative percentage of cells under the 1n and 2n peaks is indicated.
Figure 10.
Figure 10.
Degradation of Sol1 in CaCdc4-depleted cells. Myc-tagged Sol1 was expressed from the MAL2 promoter of plasmid KB1578 in strain KC200 (TETp-CaCDC4). The cells were grown overnight in SC medium + maltose and then diluted in the same medium with or without 100 μg/ml tetracycline and grown for another 8 h. Glucose was then added to the cultures to shut off the MAL2 promoter, and the protein levels were detected by Western blotting against the Myc epitope. Hydroxyurea (70 mM) was added to a portion of the cultures 2 h before glucose addition. (A) Sol1 degradation in the presence or absence of tetracycline (TET), in the absence (top) or the presence (bottom) of HU. Lane C is a non-epitope-tagged control cell extract. (B) The “+TET” samples shown in A were run adjacent to each other and submitted to a shorter exposure, to visualize the accumulation of a lower mobility species of Sol1 in the presence of hydroxyurea.
Figure 11.
Figure 11.
Effect of the overexpression of Sic1 and Sol1 in C. albicans. (A) Cellular growth is inhibited upon overexpression of truncated Sic1 and Sol1. Plasmids KB1321 (vector), KB1386 (CUP1p-SIC1), KB1389 (CUP1p-SIC1ΔN), KB1472 (CUP1p-SOL1), and KB1473 (CUP1p-SOL1ΔN) were transformed into strain KC16. Plates were photographed after 2 d at 30°C. (B) Morphology of cells overexpressing Sic1 and Sol1. The same strains as in A were photographed after 6 h in SC + 100 μM CuSO4. Vector (a), CUP1p-SIC1 (b), CUP1p-SIC1ΔN (c), CUP1p-SOL1 (d), and CUP1p-SOL1ΔN (e and f). Bar, 20 μm. (C) FACS analysis of the same strains after 6 h of growth in SC medium + 100 μM CuSO4. The numbers above the peaks represent the relative percentages of the 2n and 4n cell populations (averages of three independent experiments ± standard deviations). (D) Western blot analysis of a protein extract from the same strains. The Myc-tagged proteins were visualized with the 9E10 mAb. The * indicates an unrelated cross-reacting band.
Figure 12.
Figure 12.
Phenotypes of the sol1/– deletion. (A) Southern blotting of the SOL1region of the following strains: lane 1, SOL1/SOL1 (CAI4); lane 2, SOL1/sol1Δ::hisG-URA3-hisG (KC184); lane 3, SOL1/sol1Δ::hisG (KC185); and lane 4, sol1Δ::hisG/sol1Δ::hisG-URA3-hisG (KC186). Genomic DNA was digested with XbaI and probed with a 757-base pair BamHI-XbaI fragment from plasmid KB1606, corresponding to positions +719 to +1476 relative to the SOL1 start codon. (B) Cellular morphology of sol1/– in a logarithmic and stationary culture. The CA14, KC184, KC186, and KC239 strains were diluted 1:100 from an overnight culture and grown for 3 h at 30°C (LOG). Also shown is the KC186 overnight culture (o.n.). Bar, 20 μm. (C) Response of the sol1/– strain to serum induction of filamentation. CAI4 (SOL1+/+) and KC186 (sol1/–) overnight cultures were diluted in FCS and incubated for 2 h at 37°C. Bar, 20 μm. (D) Colony and cellular morphology of the sol1/– (KC138) versus the Cacdc4/sol1/– (KC196) strains. Colonies were grown for 2 d on YPD plates at 30°C (top row). Cells from these colonies (middle row) or from an overnight liquid culture (bottom row) were stained with calcofluor and visualized by epifluorescence. Bar, 20 μm.

Similar articles

Cited by

References

    1. Bachewich, C., Thomas, D. Y., and Whiteway, M. (2003). Depletion of a polo-like kinase in Candida albicans activates cyclase-dependent hyphal-like growth. Mol. Biol. Cell 14, 2163–2180. - PMC - PubMed
    1. Bachewich, C., and Whiteway, M. (2005). Cyclin Cln3p links G1 progression to hyphal and pseudohyphal development in Candida albicans. Eukaryot. Cell 4, 95–102. - PMC - PubMed
    1. Bai, C., Sen, P., Hofmann, K., Ma, L., Goebl, M., Harper, J. W., and Elledge, S. J. (1996). SKP1 connects cell cycle regulators to the ubiquitin proteolysis machinery through a novel motif, the F-box. Cell 86, 263–274. - PubMed
    1. Bensen, E. S., Filler, S. G., and Berman, J. (2002). A forkhead transcription factor is important for true hyphal as well as yeast morphogenesis in Candida albicans. Eukaryot. Cell 1, 787–798. - PMC - PubMed
    1. Birse, C. E., Irwin, M. Y., Fonzi, W. A., and Sypherd, P. S. (1993). Cloning and characterization of ECE1, a gene expressed in association with cell elongation of the dimorphic pathogen Candida albicans. Infect. Immun. 61, 3648–3655. - PMC - PubMed

Publication types

MeSH terms