. 2005 Jun;16(6):2862-71.
doi: 10.1091/mbc.e05-01-0041. Epub 2005 Apr 6.

Tracking the interactions of rRNA processing proteins during nucleolar assembly in living cells

Affiliations

Tracking the interactions of rRNA processing proteins during nucleolar assembly in living cells

Nicole Angelier et al. Mol Biol Cell. 2005 Jun.

Abstract

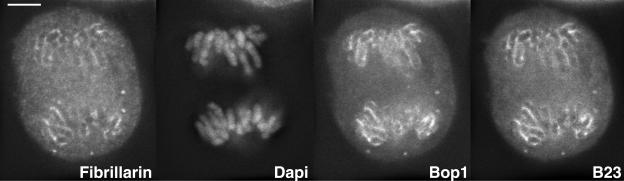
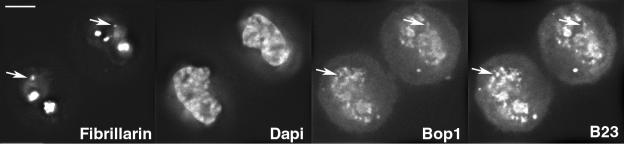
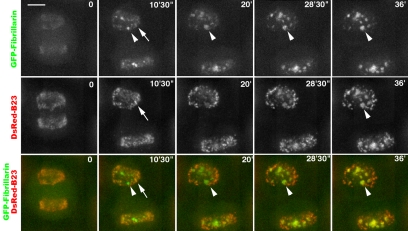
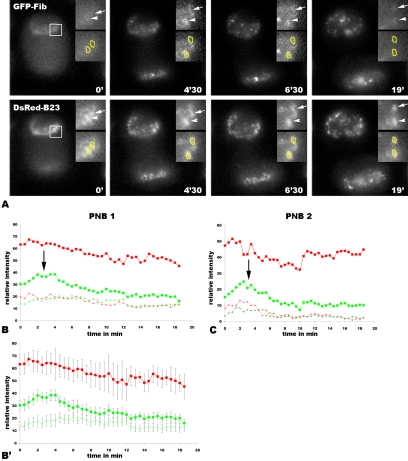
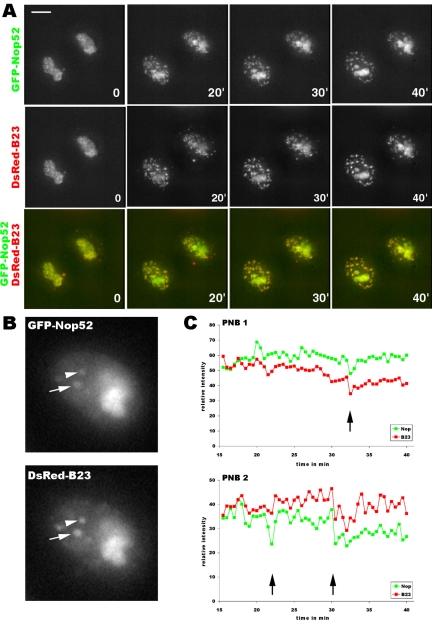
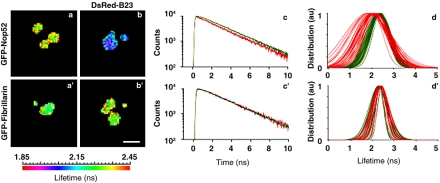
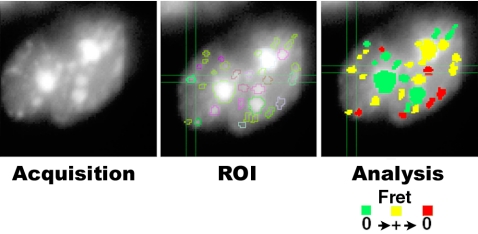
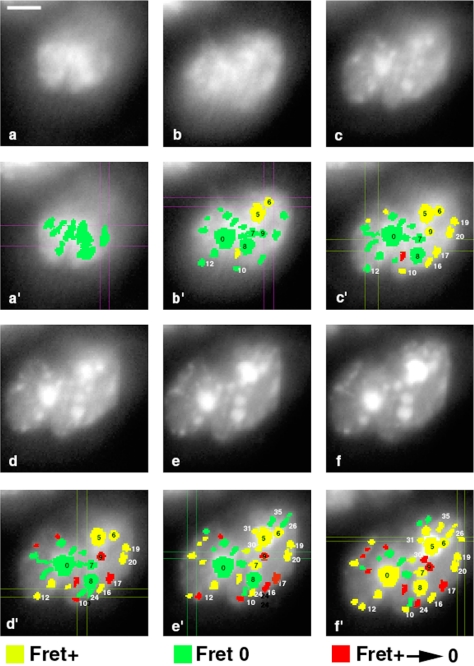
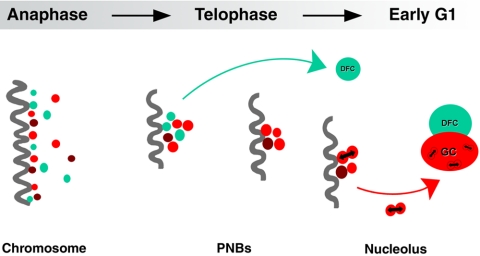
Reorganization of the nuclear machinery after mitosis is a fundamental but poorly understood process. Here, we investigate the recruitment of the nucleolar processing proteins in the nucleolus of living cells at the time of nucleus formation. We question the role of the prenucleolar bodies (PNBs), during migration of the processing proteins from the chromosome periphery to sites of rDNA transcription. Surprisingly, early and late processing proteins pass through the same PNBs as demonstrated by rapid two-color four-dimensional imaging and quantification, whereas a different order of processing protein recruitment into nucleoli is supported by differential sorting. Protein interactions along the recruitment pathway were investigated using a promising time-lapse analysis of fluorescence resonance energy transfer. For the first time, it was possible to detect in living cells the interactions between proteins of the same rRNA processing machinery in nucleoli. Interestingly interactions between such proteins also occur in PNBs but not at the chromosome periphery. The dynamics of these interactions suggests that PNBs are preassembly platforms for rRNA processing complexes.


Figures

Figure 1.
Figure 1.
Relative distribution of early (fibrillarin) and late (Bop1 and B23) rRNA processing proteins during anaphase. Immunolocalization of fibrillarin and B23 in a permanently transfected GFP-Bop1 cell. The chromosomes are visualized by DAPI. The same focal plane is shown after deconvolution. Fibrillarin, GFP-Bop1, and protein B23 show the same distribution, mainly at the chromosome periphery and some dispersed in the cytoplasm. On chromosomes, the distribution is homogeneous and the few foci visible correspond to bending of chromosomes. A 3D reconstruction comprising all the focal planes of the same cell is presented in Video 1. Bar, 10 μm.
Figure 2.
Figure 2.
Relative distribution of early (fibrillarin) and late (Bop1 and B23) rRNA processing proteins during early G1. Immunolocalization of fibrillarin and B23 in a permanently transfected GFP-Bop1 cell. The chromosomes are visualized by DAPI. The same focal plane is shown after deconvolution. Fibrillarin is recruited in the nucleoli and few foci are visible outside the nucleoli (arrows). Protein GFP-Bop1 and B23 show the same distribution in PNBs at the chromosome periphery and weak accumulation in nucleoli. The fibrillarin foci colocalize with Bop1 and B23 PNBs (arrows). Bar, 10 μm.
Figure 3.
Figure 3.
Different dynamics of fibrillarin and B23 in the same living cell during nucleolar assembly. Two-color 4D imaging from telophase to early G1. At time 0 (i.e., 9′ 30″ after the onset of anaphase) both GFP-fibrillarin and DsRed-B23 are in PNBs; in comparison, the same focal planes with the merged picture indicates that the same PNBs contain both GFP-fibrillarin and DsRed-B23 (arrow at 10′ 30″). At 10′ 30″, fibrillarin is already delivered to incipient nucleoli (arrowhead), whereas DsRed-B23 is recruited in nucleoli later, at 28′ 30″. Differential sorting of fibrillarin and B23 from PNBs is visualized in merged focal planes by a progression with time from orange to red of PNBs that have lost fibrillarin and by progression of nascent nucleoli from green to yellow. See Video 2 for kinetics starting in metaphase. Bar, 10 μm.
Figure 4.
Figure 4.
Differential sorting of GFP-fibrillarin/DsRed-B23 from the same PNBs. (A) Time-lapse sequence from three consecutive focal planes containing two PNBs (white square) visible in Figure 3 and Video 2. Time 0 correspond to 9′ 30″ after the onset of anaphase visualized by chromosome segregation. Enlarged PNBs are shown in the inserts (PNB1, arrow, and PNB2, arrowhead). PNBs containing DsRed-B23 are visible during the time-lapse sequence. GFP-fibrillarin rapidly accumulates in the same PNBs during short time. (B and C) Graphs represent relative fluorescence of GFP and DsRed in each PNB during 19 min. The curves with large red squares represent DsRed-B23 in PNB, and the green squares represent GFP-fibrillarin. The dotted red and green curves represent DsRed and GFP in an area without PNBs, i.e., defined as diffuse proteins. The black arrows in B and C indicate, in B23-containing PNBs, 4 to 5 times higher fibrillarin concentrations compared with dispersed proteins. (B′) The same DsRed-B23 and GFP-fibrillarin curves with standard deviations (vertical bars), respectively, indicate that the relative intensity of GFP-fibrillarin is significantly higher in PNB during 5 min compared with diffuse proteins.
Figure 5.
Figure 5.
Similar kinetics of GFP-Nop52/DsRed-B23. (A) Time-lapse sequence from telophase to early G1. At time 0 (i.e., 20′ after the beginning of anaphase), GFP-Nop52 and DsRed-B23 show the same dynamics during the formation of PNBs as well as during recruitment of these proteins and accumulation in nucleoli. In the same focal planes, images of GFP and DsRed are exactly superimposable. The bright dots outside the nucleus correspond to the nucleolar derived foci (NDF). These bodies moved within the cytoplasm (as described by Dundr et al., 2000 and Video 3). In NDF, the concentration of B23 is higher than of Nop52, red foci are visible in merge images (Figure 5A, 0 and 20′). The time-lapse images were recorded in auto-scale that consequently decreased the general intensity level when bright foci are included in the images. This is the case of B23 during the first 20 min and because there is no Nop52 foci, the signals are brighter for Nop52 in the nucleus. See Video 3 for kinetics. Bar, 10 μm. (B) Enlargement of a nucleus to show the PNBs in three consecutive merged optical sections that were analyzed (PNB1, arrow, and PNB2, arrowhead). (C) Relative fluorescence intensity from 15 to 40 min. The green curves correspond to GFP-Nop52 and red curves to Dsred-B23. The black arrows indicate similar fluctuations for both proteins, suggesting simultaneous release.
Figure 6.
Figure 6.
During interphase, Nop52 and protein B23 interact in the nucleolus of living cells. tdFLIM-FRET measurements were carried out by acquiring fluorescence decay images of the GFP donor (515 nm < λ < 560 nm) in permanent cell lines expressing GFP-Nop52 (a–d) or GFP-fibrillarin (a′–d′), alone (a, a′, and green curves) or in the presence of the DsRed acceptor after transfection with DsRed-B23 (b, b′, and red curves). The tdFLIM images were obtained by analyzing pixel by pixel the fluorescence decays with a single lifetime and are displayed as fluorescence lifetime pseudocolored maps (a, a′, b, and b′). The lifetime between 2.45 and 1.85 ns is indicated by colors presented in the scale. The nucleolus-associated fluorescence decay of GFP-tagged proteins is visible and compared in c and c′ to donor alone (green curves, GFP-Nop52 and GFP-fibrillarin, respectively) and to donor with acceptor (red curves, DsRed-B23). Fits of these fluorescence decays were carried out using a Gaussian distribution lifetime model, and the complete results are plotted in d for Nop52GFP alone (green curves, n = 53) and in the presence of B23DsRed (red curves, n = 35), and in d′ for GFP-fibrillarin alone (green curves, n = 22) and in the presence of DsRed-B23 (red curves, n = 21). Bar, 10 μm.
Figure 7.
Figure 7.
Detection of FRET in regions of interest. Global acquisition of tdFLIM data is displayed as total fluorescence intensity image to manually draw the different ROI for the analysis of FRET. Fluorescence decays coming from these regions were then individually fitted with a Marquardt nonlinear least-square algorithm by using a Gaussian distribution of lifetimes. The region is green for negative FRET (no variation in the center of the fluorescence lifetime distribution of the GFP-tagged protein in the presence of the DsRed-tagged protein compared with the control experiment of GFP-tagged protein alone); it is yellow when FRET occurs (reduction in the position of the center of the fluorescence lifetime distribution of the GFP-tagged protein superior or equal to 200 ps); and it is red if a region was considered negative after having been positive.
Figure 8.
Figure 8.
Time-lapse of the Nop52/B23 interactions studied during nucleolus assembly by tdFLIM-FRET. Time-lapse tdFLIM-FRET measurements were carried out by acquiring fluorescence decay images of the GFP donor (515 nm < λ < 560 nm) in permanent cell lines expressing GFP-Nop52 in the presence of the acceptor (DsRed) of protein DsRed-B23. The measurement was carried out continuously for the 120-min acquisition time from late anaphase to early G1. The data were separated in six parts of 20 min each to build up time-lapse tdFLIM data. Time-lapse total fluorescence intensity images (equivalent to steady state fluorescence intensity images) are displayed in a (t = 0–20 min), b (t = 20–40 min), c (t = 40–60 min), d (t = 60–80 min), e (t = 80–100 min), and f (t = 100–120 min). The fluorescence decays of the regions of interest (numbered from 0 to 35) corresponding to PNBs or incipient nucleoli were obtained by extraction from each set of data. Using a Gaussian distribution of lifetime as model fit, decays were analyzed and sorted into three FRET groups: negative (green), positive (yellow), and negative after having been positive (red). Visualization of time-lapse tdFLIM-FRET are done in a′ (t = 0–20 min), b′ (t = 20–40 min), c′ (t = 40–60 min), d′ (t = 60–80 min), e′ (t = 80–100 min), and f′ (t = 100–120 min). Bar, 10 μm.
Figure 9.
Figure 9.
Kinetics of rRNA processing proteins during nucleolar reconstruction. During anaphase, proteins of early (fibrillarin, green spots) and late (Nop52 and B23, red spots) rRNA processing machineries colocalize at the periphery of chromosomes (dark fiber). At the beginning of telophase, these proteins regroup in PNBs; early and late rRNA processing proteins pass through the same PNBs. Recruitment of rRNA processing proteins in the nucleolus then occurs according to differential sorting from the same PNBs of early (fibrillarin into dense fibrillar component; DFC) and late (Nop52 and B23 into granular component; GC) processing proteins (see Results). As a consequence, at the beginning of telophase, PNBs contain all the rRNA processing proteins. In contrast, after recruitment of the early rRNA processing proteins by the incipient nucleolus, PNBs only retain the late rRNA processing proteins. Interactions detected between proteins of the same rRNA processing machinery (visualized by bidirectional arrows between Nop52 and B23) in both PNBs and nucleolus suggest that PNBs are preassembly platforms for rRNA processing complexes.

Similar articles

Cited by

References

    1. Azum-Gélade, M.-C., Noaillac-Depeyre, J., Caizergues-Ferrer, M., and Gas, N. (1994). Cell cycle redistribution of U3 snRNA and fibrillarin. Presence in the cytoplasmic nucleolus remnant and in the prenucleolar bodies at telophase. J. Cell Sci. 107, 463–475. - PubMed
    1. Bastiaens, P. I., and Squire, A. (1999). Fluorescence lifetime imaging microscopy: spatial resolution of biochemical processes in the cell. Trends Cell Biol. 9, 48–52. - PubMed
    1. Bell, P., Dabauvalle, M. C., and Scheer, U. (1992). In vitro assembly of prenucleolar bodies in Xenopus egg extract. J. Cell Biol. 118, 1297–1304. - PMC - PubMed
    1. Bubulya, P. A., Prasanth, K. V., Deerinck, T. J., Gerlich, D., Beaudouin, J., Ellisman, M. H., Ellenberg, J., and Spector, D. L. (2004). Hypophosphorylated SR splicing factors transiently localize around active nucleolar organizing regions in telophase daughter nuclei. J. Cell Biol. 167, 51–63. - PMC - PubMed
    1. Chen, D., and Huang, S. (2001). Nucleolar components involved in ribosome biogenesis cycle between the nucleolus and nucleoplasm in interphase cells. J. Cell Biol. 153, 169–176. - PMC - PubMed

Publication types

LinkOut - more resources