

Magnetic susceptibility-weighted MR phase imaging of the human brain
- PMID: 15814914
- PMCID: PMC7977092
Magnetic susceptibility-weighted MR phase imaging of the human brain
Abstract
Background and purpose: MR gradient echo imaging is sensitive to the magnetic susceptibility of different tissue types. The purpose of this study was to investigate the diagnostic potential of MR phase imaging of the human brain.
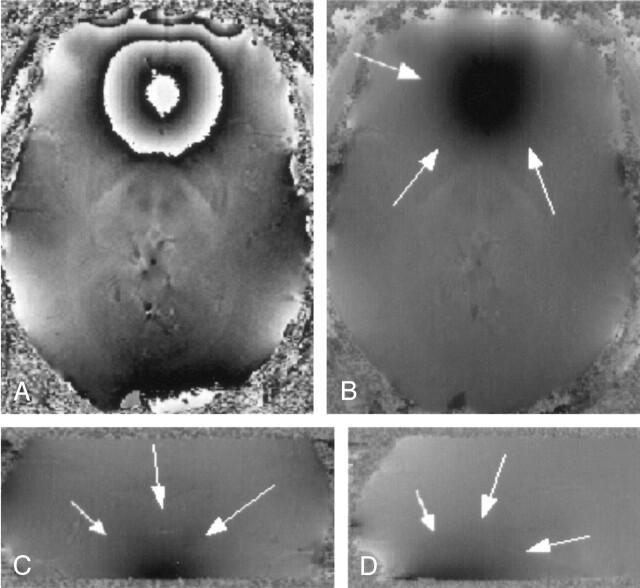
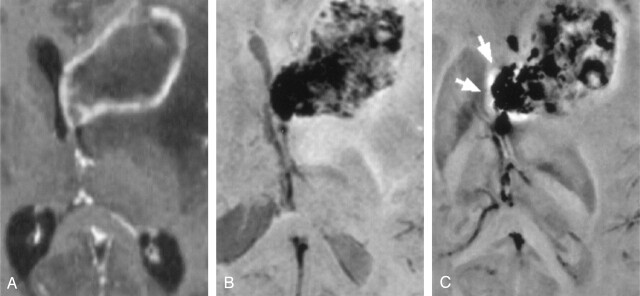
Methods: High-spatial-resolution, T2*-weighted, single-echo images were acquired in five volunteers and one patient with a brain tumor on a 1.5T system by applying a 3D, first-order, velocity-compensated gradient echo sequence by using a quadrature transmit-receive head coil. Phase images were reconstructed from the raw data and unwrapped by using a region-growing phase-unwrapping algorithm. Low-spatial-frequency components originating from static background susceptibility effects were removed by high-pass filtering.
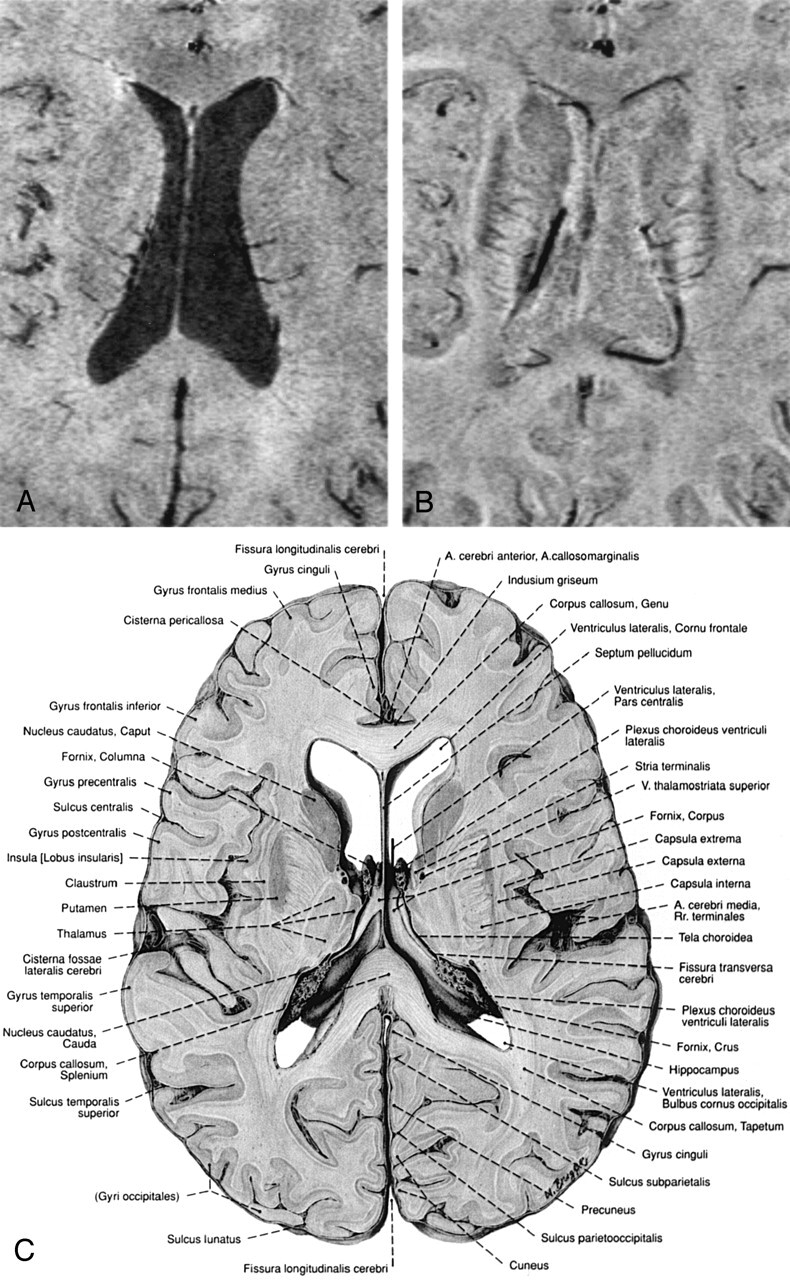
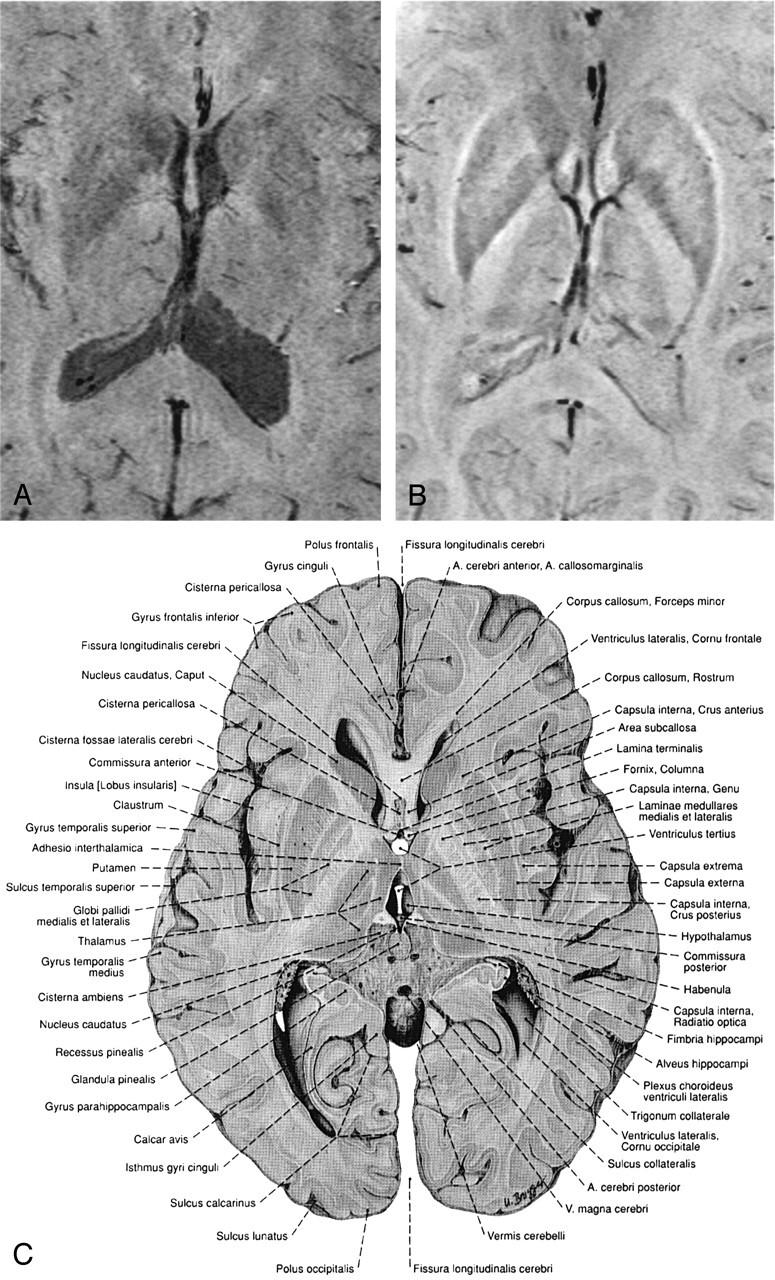
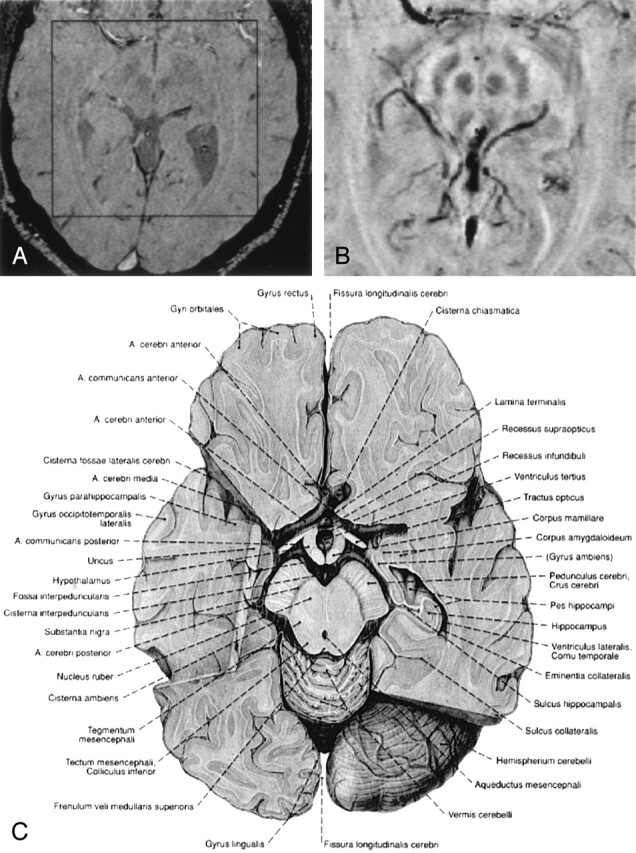
Results: Phase images showed excellent image contrast and revealed anatomic structures that were not visible on the corresponding magnitude images.
Conclusion: Improved processing of susceptibility-weighted MR phase images offers a new means of contrast for neuroimaging applications.
Figures
Similar articles
-
Automated unwrapping of MR phase images applied to BOLD MR-venography at 3 Tesla.J Magn Reson Imaging. 2003 Aug;18(2):175-80. doi: 10.1002/jmri.10346. J Magn Reson Imaging. 2003. PMID: 12884329
-
STrategically Acquired Gradient Echo (STAGE) imaging, part I: Creating enhanced T1 contrast and standardized susceptibility weighted imaging and quantitative susceptibility mapping.Magn Reson Imaging. 2018 Feb;46:130-139. doi: 10.1016/j.mri.2017.10.005. Epub 2017 Oct 19. Magn Reson Imaging. 2018. PMID: 29056394
-
Susceptibility weighted imaging: data acquisition, image reconstruction and clinical applications.Z Med Phys. 2006;16(4):240-50. doi: 10.1078/0939-3889-00322. Z Med Phys. 2006. PMID: 17216749
-
Clinical applications of neuroimaging with susceptibility-weighted imaging.J Magn Reson Imaging. 2005 Oct;22(4):439-50. doi: 10.1002/jmri.20404. J Magn Reson Imaging. 2005. PMID: 16163700 Review.
-
Clinical applications of susceptibility weighted MR imaging of the brain - a pictorial review.Neuroradiology. 2008 Feb;50(2):105-16. doi: 10.1007/s00234-007-0316-z. Epub 2007 Oct 11. Neuroradiology. 2008. PMID: 17929005 Review.
Cited by
-
On the role of neuronal magnetic susceptibility and structure symmetry on gradient echo MR signal formation.Magn Reson Med. 2014 Jan;71(1):345-53. doi: 10.1002/mrm.24629. Epub 2013 Feb 4. Magn Reson Med. 2014. PMID: 23382087 Free PMC article.
-
In vivo structural imaging of the cerebellum, the contribution of ultra-high fields.Cerebellum. 2012 Jun;11(2):384-91. doi: 10.1007/s12311-010-0189-2. Cerebellum. 2012. PMID: 20596807 Review.
-
A Magnetic Resonance-Relaxometry-Based Technique to Identify Blood Products in Brain Parenchyma: An Experimental Study on a Rabbit Model.Front Vet Sci. 2022 May 31;9:802272. doi: 10.3389/fvets.2022.802272. eCollection 2022. Front Vet Sci. 2022. PMID: 35711807 Free PMC article.
-
Splenic siderotic nodules in patients with liver cirrhosis.Exp Ther Med. 2013 Aug;6(2):445-450. doi: 10.3892/etm.2013.1135. Epub 2013 May 31. Exp Ther Med. 2013. PMID: 24137205 Free PMC article.
-
Delineation of the nerve fiber bundles of the infant brain associated with aging using phase difference-enhanced imaging: a preliminary study.Jpn J Radiol. 2020 Aug;38(8):731-739. doi: 10.1007/s11604-020-00955-z. Epub 2020 Mar 30. Jpn J Radiol. 2020. PMID: 32232647
References
-
- Dumoulin C. Phase contrast MR angiography techniques. Magn Reson Imaging Clin N Am 1995;3:399–411 - PubMed
-
- Reichenbach JR, Jonetz-Mentzel L, Fitzek C, et al. High resolution blood oxygen level dependent MR venography (HRBV): a new technique. Neuroradiology 2001;43:364–369 - PubMed
-
- Reichenbach JR, Haacke EM. High-resolution BOLD venographic imaging: a window into brain function. NMR Biomed 2001;14:453–467 - PubMed
-
- Jezzard P, Balaban RS. Correction for geometric distortion in echo planar images from field variations. Magn Reson Med 1995;34:65–73 - PubMed
-
- Quesson B, de Zwart JA, Moonen CT. Magnetic resonance temperature imaging for guidance of thermotherapy. J Magn Reson Imaging 2000;12:525–533 - PubMed
Publication types
MeSH terms
LinkOut - more resources
Full Text Sources
Other Literature Sources
Medical