Review
. 2005 Apr;206(4):319-48.
doi: 10.1111/j.1469-7580.2005.00395.x.

Retinal vascular image analysis as a potential screening tool for cerebrovascular disease: a rationale based on homology between cerebral and retinal microvasculatures

Affiliations
Free PMC article
Review

Retinal vascular image analysis as a potential screening tool for cerebrovascular disease: a rationale based on homology between cerebral and retinal microvasculatures

Niall Patton et al. J Anat. 2005 Apr.
Free PMC article

Abstract

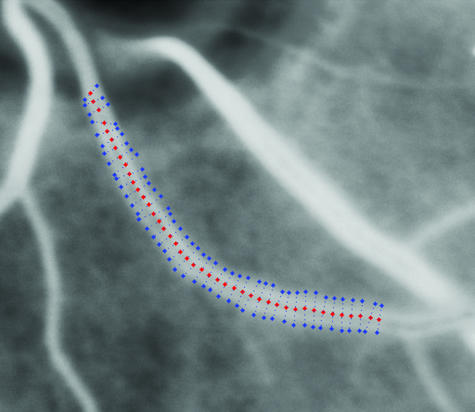
The retinal and cerebral microvasculatures share many morphological and physiological properties. Assessment of the cerebral microvasculature requires highly specialized and expensive techniques. The potential for using non-invasive clinical assessment of the retinal microvasculature as a marker of the state of the cerebrovasculature offers clear advantages, owing to the ease with which the retinal vasculature can be directly visualized in vivo and photographed due to its essential two-dimensional nature. The use of retinal digital image analysis is becoming increasingly common, and offers new techniques to analyse different aspects of retinal vascular topography, including retinal vascular widths, geometrical attributes at vessel bifurcations and vessel tracking. Being predominantly automated and objective, these techniques offer an exciting opportunity to study the potential to identify retinal microvascular abnormalities as markers of cerebrovascular pathology. In this review, we describe the anatomical and physiological homology between the retinal and cerebral microvasculatures. We review the evidence that retinal microvascular changes occur in cerebrovascular disease and review current retinal image analysis tools that may allow us to use different aspects of the retinal microvasculature as potential markers for the state of the cerebral microvasculature.


Figures

Fig. 1
Fig. 1
Schematic diagram of the mechanical and metabolic components of the blood–brain and blood–retinal barriers and the influence of glial cells on these barriers. The mechanical component consists of the presence of apical (luminal) tight junctions composed of proteins such as occludin, claudins and junctional adhesion molecules (JAMs), often in conjunction with submembranous tight-junction-associated proteins, such as zonula occludens. The metabolic component consists of transport proteins, including GLUT-1, P-glycoprotein and transferritin.
Fig. 2
Fig. 2
Schematic diagram of (a) the retinal and (b) the cerebral microvessel (not drawn to scale). Note the greater pericyte coverage on the retinal endothelium, and the smaller calibre of the retinal vessel. OBF, ocular blood flow; CBF, cerebral blood flow.
Fig. 3
Fig. 3
Schematic diagram of the myogenic (via pericytes/vascular smooth muscle) and metabolic components of vascular autoregulation of the retinal and cerebral microvasculature. IOP, intraocular pressure; ICP, intracranial pressure; NO, nitric oxide.
Fig. 4
Fig. 4
A greyscale image of a region of the retina, with a line drawn perpendicular to a retinal arteriole. Note the central light reflex from the arteriole.
Fig. 5
Fig. 5
A typical intensity profile of a cross-section of a retinal arteriole. A curve of best fit has been superimposed on the actual intensity data, showing a double-Gaussian configuration. The height of the intensity profile is calculated by subtracting the background intensity from the peak intensity measured across the vessel. The width of the blood vessel is then measured at the ‘half-height’.
Fig. 6
Fig. 6
(a) An unenhanced RGB image showing moderate delineation of the blood vessels. (b) Image in (a) after greyscale conversion and CLAHE enhancement. The retinal vessels are clearly more prominent.
Fig. 7
Fig. 7
A region of interest within an enhanced greyscale fundal image has been selected to include a bifurcation of a parent vessel into two daughter vessels. Image analysis programming allows the angle between the two daughter vessels to be calculated.
Fig. 8
Fig. 8
Greyscale image showing a retinal vessel tracking procedure using a Gaussian elongated filter, having been given starting and ending points.

References

    1. Abbott NJ, Revest PA, Romero IA. Astrocyte–endothelial interaction: physiology and pathology. Neuropathol. Appl. Neurobiol. 1992;18:424–433. - PubMed
    1. Abbott NJ. Inflammatory mediators and modulation of blood–brain barrier permeability. Cell Mol. Neurobiol. 2000;20:131–147. - PMC - PubMed
    1. Abernathy WB, Bell MA, Morris M, Moody DM. Microvascular density of the human paraventricular nucleus decreases with aging but not hypertension. Exp. Neurol. 1993;121:270–274. - PubMed
    1. Adachi T, Inanami O, Sato A. Nitric Oxide (NO) is involved in increased cerebral cortical blood flow following stimulation of the nucleus basalis of Meynert in anesthetized rats. Neurosci. Lett. 1992;139:201–204. - PubMed
    1. Addison D, Garner A, Ashton N. Degeneration of intramural pericytes in diabetic retinopathy. Br. Med. J. 1970;1:264–266. - PMC - PubMed

LinkOut - more resources